

How the GA4 report snapshot works
The Google Analytics 4 (GA4) report snapshot provides a customizable, high-level overview of your property’s performance by consolidating key metrics and data from various detailed reports into summary “cards.”
After exporting the report, it will look like a bunch of numbers. Instead, you can view the needed metrics through the cards.
Customisation is easy in the snapshot by adding, removing, or rearranging those report cards.
Report Snapshot overview
1. Default View:
After configuring your website to the GA4 account, it will create a report page by default. By default you can see cards with specific metrics.
2. Customisation:
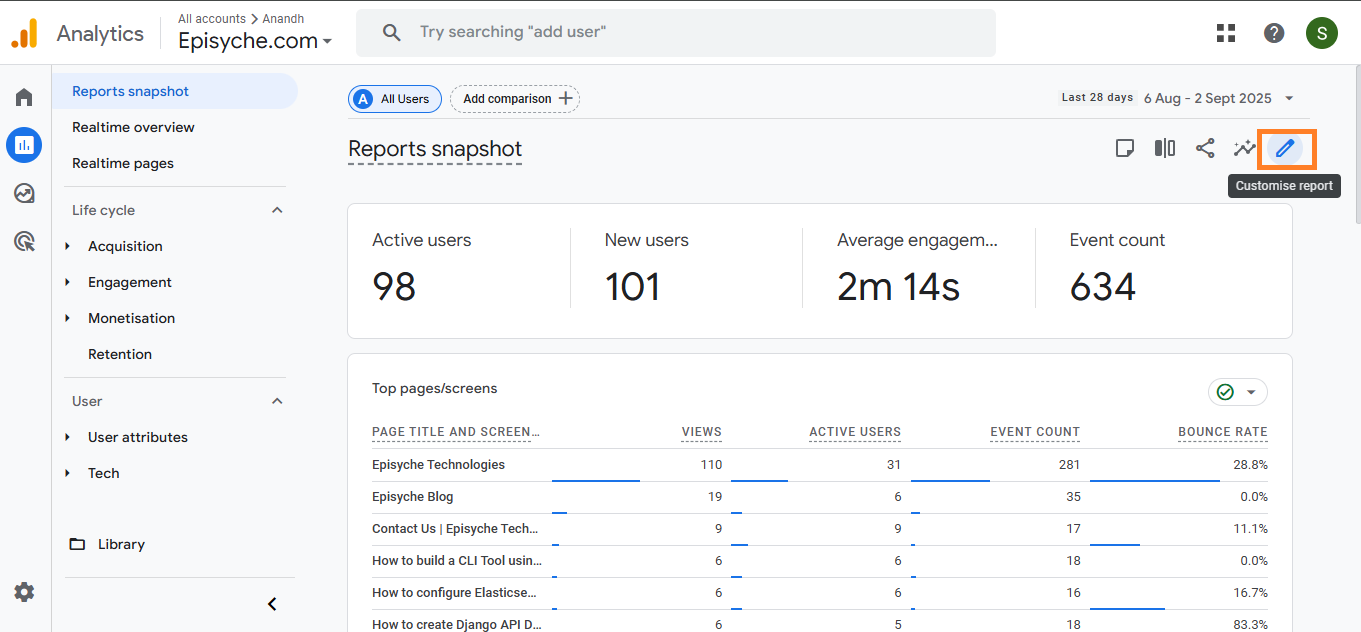
a. Click the pencil icon in the top-right corner to enter edit mode for customise metrics and dimensions.
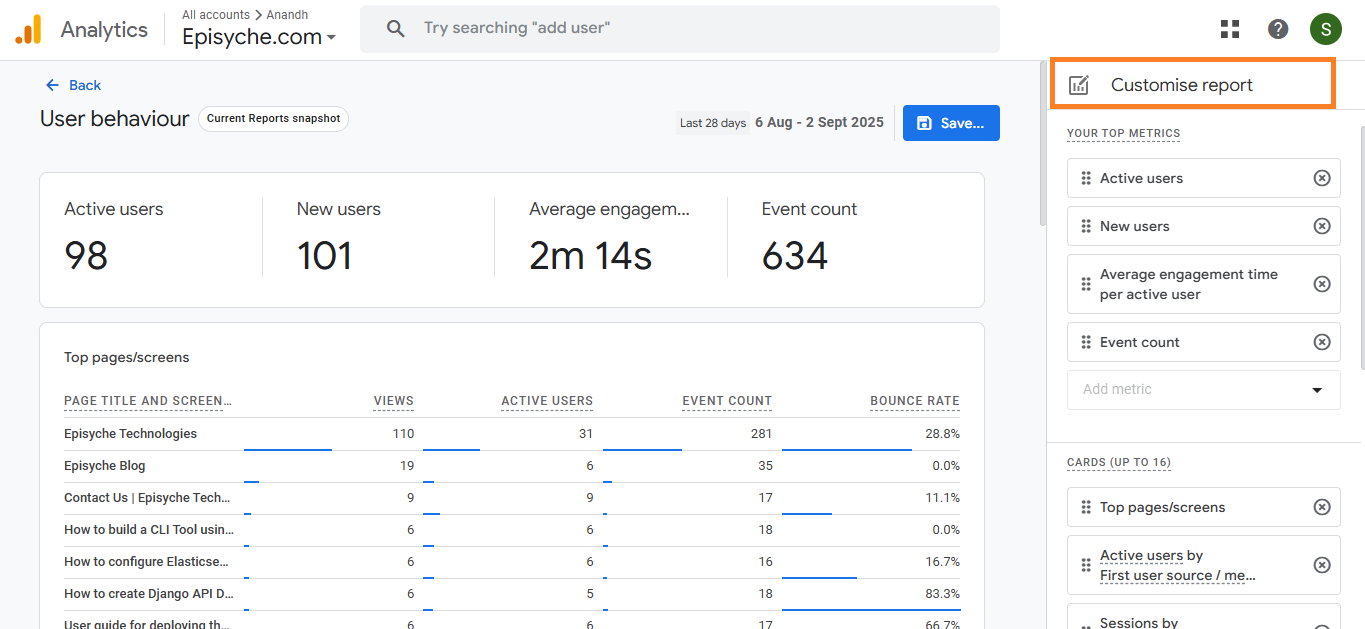
b. Then click “Customise report” to customise your cards. In this, you can add metrics and cards (up to 16 cards) and rearrange cards.
3. Deep links
Most cards in the snapshot act as “deeplinks.” Clicking on a card’s right bottom corner text. That will take you directly to the detailed report. That is the summary card allowing for deeper analysis.
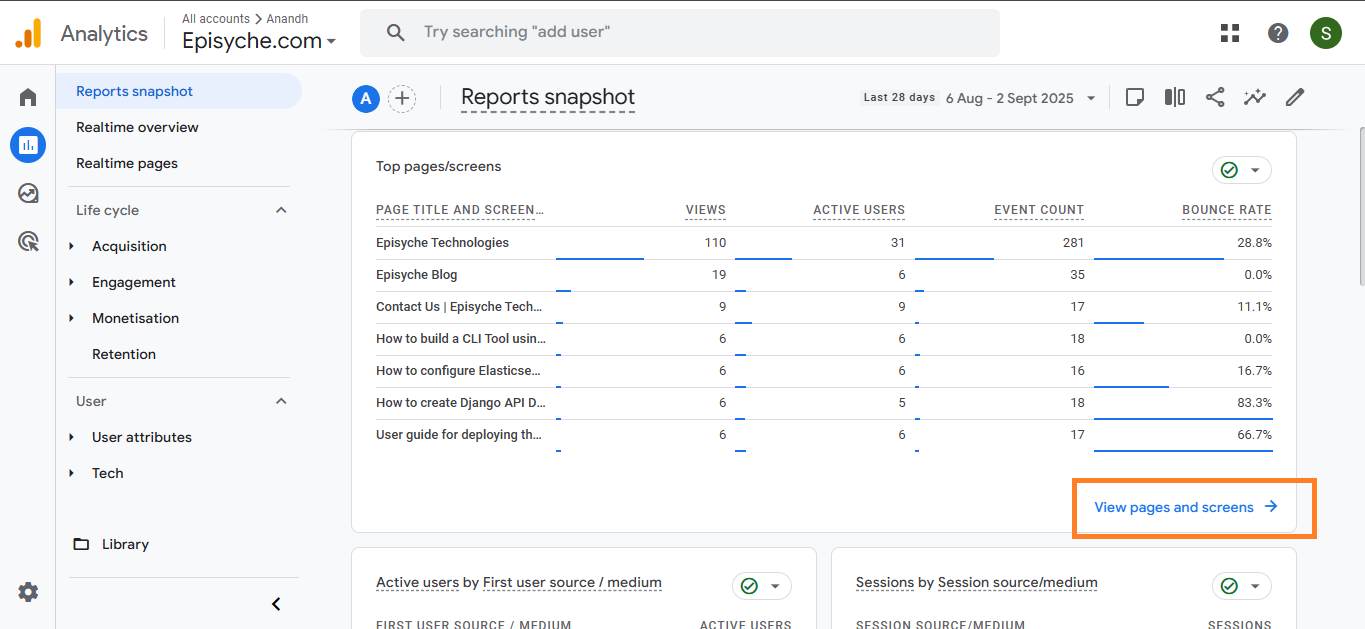
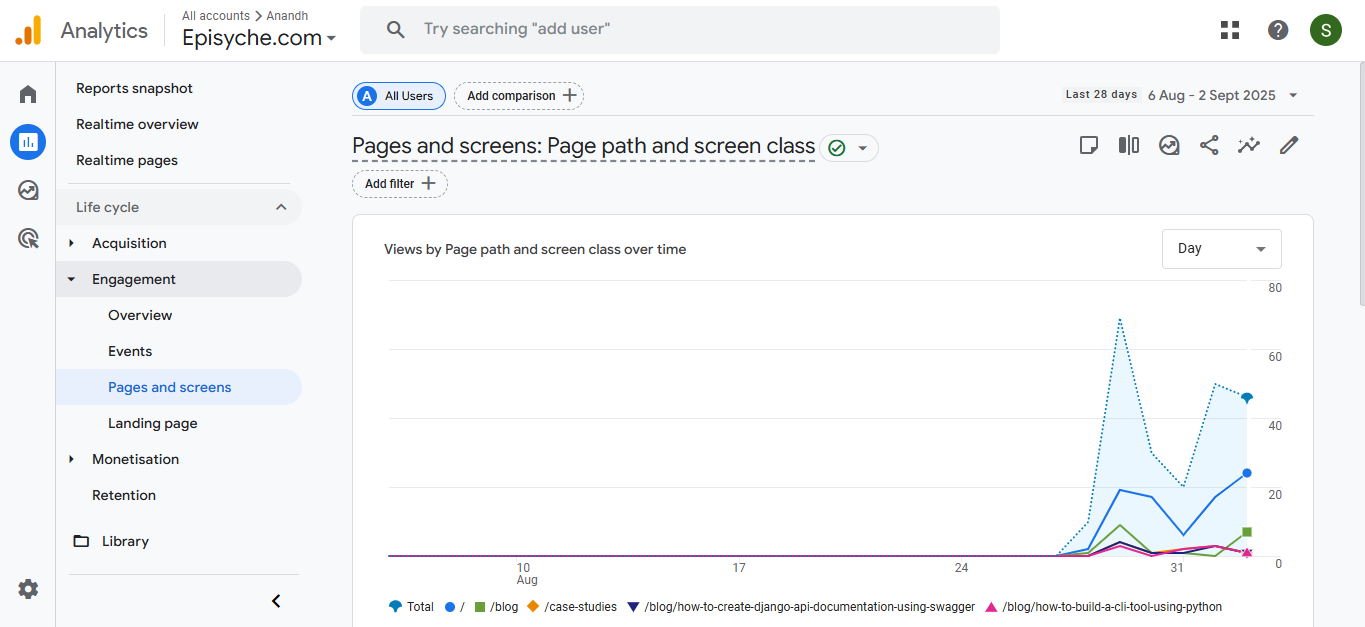
Each card will display the detailed report
4. Templates
Choose from different templates to get a starting point for your overview. Let’s see the different types of templates in GA4.
Templates for report snapshot
Google Analytics introduced three types of pre-built templates for ease of access. You can manually edit the templates to quickly access insights.
User behaviour
Sales and revenue
Marketing performance
What are dimensions?
These are descriptive attributes of your data. They tell you “what” or “who” something is.
E.g. - Country, Device type, Page title, Source/Medium
What are metrics?
These are quantitative measurements. They tell you “how” or “how many.”
E.g. - activeUsers, sessions, conversions, engagementTime.
1. User Behaviour Template
The user behaviour template shows the data on how visitors are interacting with your site or app.
Focusing on how users engage, including metrics like active users, engaged sessions, page views, and average engagement time.
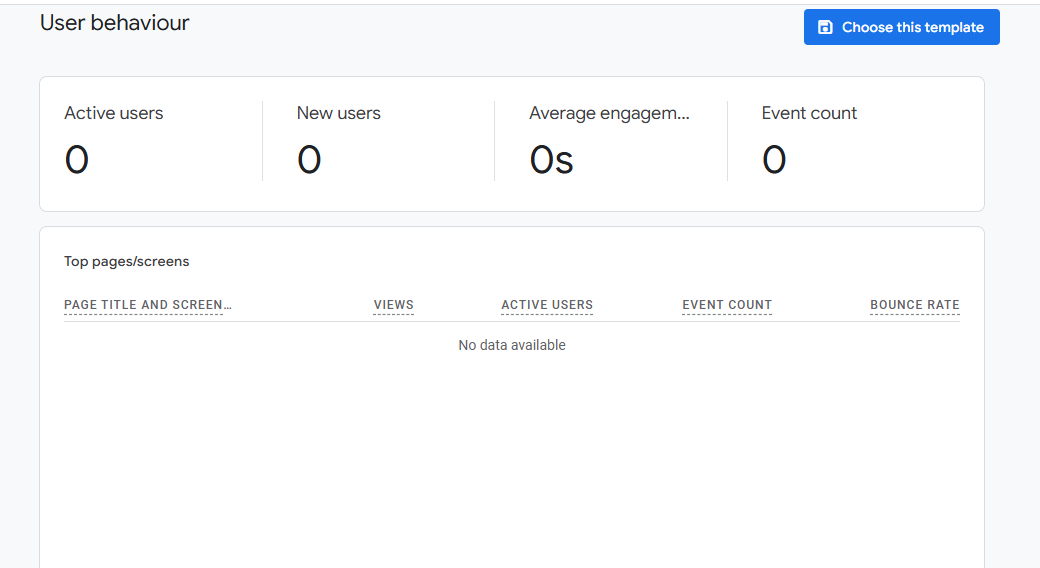
Metrics in the user behaviour template:
1. Active users
Metric Name - activeUsers
An active user is a visitor of your app or site and engaged within a particular date range.
This metric in GA4 meets at least one of the following criteria within a given date range:
The user’s session lasted 10 seconds or longer
The user viewed two or more pages or screens
The user triggered a conversion event
2. New users
Metric Name - newUsers
This metric is a unique individual who visits your website or app for the first time within a specific date range.
The first-time visit is recorded with a “first_visit” (for web) event or “first_open” (for apps) event.
3. Average engagement time per active user
This metric is valid in GA4, but it’s not available as a direct metric with that exact name.
Instead, you can calculate it manually using these two valid GA4 metrics
Metric Names - userEngagementDuration, activeUsers
averageEngagementTimePerUser = userEngagementDuration / activeUsers4. Event count
Metric Name - eventCount
This metric is defined as the total number of times a specific user action (an event) occurred on your website or app within a given time period. GA4 treats everything as an event.
5. Views
Metric Name - pageViews
Views refer to the metric for the total number of times a web page or screen was viewed (including repeats).
6. Bounce rate
Metric Name - bounceRate
Bounce rate is defined as the percentage of sessions that were not engaged. That means visitors left your site or app without meeting specific criteria for an engaged session.
7. Key events
Metric Name - keyEvents
A key event is an event that measures an action that’s particularly important to the success of your business.
When someone triggers the event by performing the action, the key event is recorded.
8. Total revenue
Metric Name - totalRevenue
Total revenue shows the total amount of revenue per day generated from e-commerce purchases, in-app purchases, subscriptions, and advertisements, minus any refunds given.
totalRevenue = e-commerce purchases + in-app purchases + subscriptions + adveertisements
                                        - refund
9. Sessions
Metric Name - sessions
A session is a period during which a user is actively engaged with your website or app.
A new session begins in some cases:
When a user first opens the app in the foreground
views a page/screen
It continues until there’s no activity for a set period or until a new campaign parameter is detected.
Dimensions in the user behaviour template
Page title and screen class - pageTitle
First user source/medium - firstUserSourceMedium
Session source/medium - sessionSourceMedium
2. Sales and revenue template
This template is used to track, analyse, and forecast a company’s sales and performance and incoming revenue over a specific period.
It highlights performance related to conversions, purchase value, and revenue trends for e-commerce.
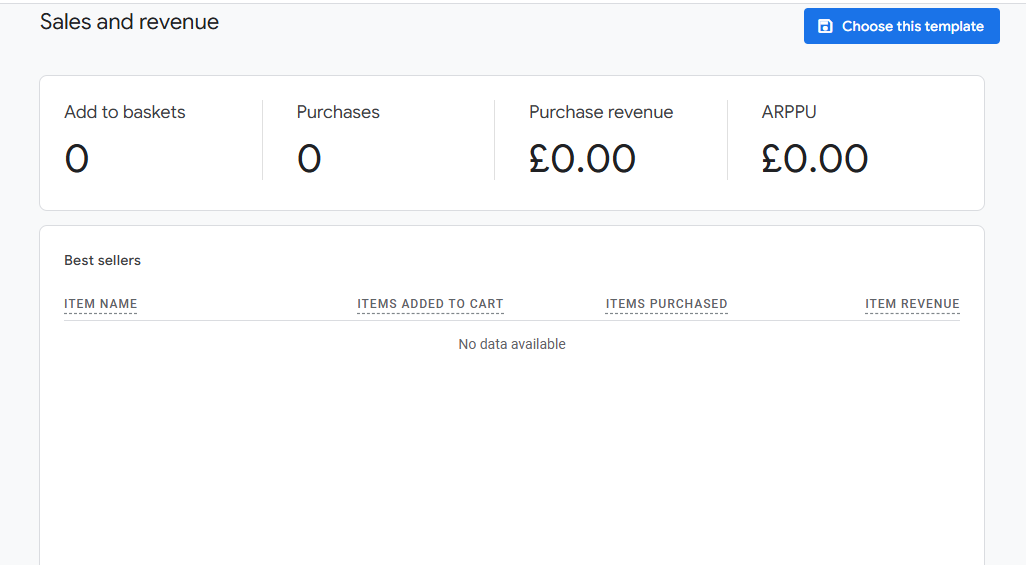
Metrics in the sales and revenue template
1. Add to Basket
Metric Name - addToCarts (Event)
The “add to cart” metric shows how many times a user adds items to the cart on your app or website. Sometimes it is referred to as an add-to-basket metric.
When a user or visitor adds a product to their shopping cart on your website this event will be noticed.
2. Purchases
Metric Name - purchase
The purchase metric tracks the number of times a purchase occurs on your website or app.
It’s different from just “add to cart” or “begin checkout”—this metric only counts successful purchases.
3. Purchase revenue
Metric Name - purchaseRevenue
The sum of revenue from purchases minus refunded transaction revenue made in your app or site.
Purchase revenue sums the revenue for these events.
purchase
ecommerce_purchase
in_app_purchase
app_store_subscription_convert
app_store_subscription_renew
4. Average purchase revenue per paying user
Metric Name - averagePurchaseRevenuePerPayingUser
Average purchase revenue per paying user (ARPPU) is the total purchase revenue per active user that logged a purchase event.
5. Items added to cart
Metric Name - itemsAddedToCart
The number of units added to the cart for a single item.
This metric counts the quantity of items in add_to_cart events.
6. Items purchased
Metric Name - itemsPurchased
The number of units for a single item included in purchase events.
This metric counts the quantity of items in purchase events.
7. Item revenue
Metric Name - itemRevenue
The total revenue from purchases minus refunded transaction revenue from items only.
Item revenue is the product of its price and quantity.
8. Session key event rate
Metric Name - sessionKeyEventRate
The percentage of sessions in which any key event was triggered.
9. Average purchase revenue per active user
This is valid, but GA4 doesn’t have an exact metric with this name.
This shows how much purchase revenue (from e-commerce transactions) you’re generating per active user over a selected date range.
averagePurchaseRevenuePerActiveUser = purchaseRevenue / activeUsersDimensions in the sales and revenue template:
Item name - itemName
first user source/medium - firstUserSourceMedium
session source/medium - sessionSourceMedium
3. Marketing performance template
By using this marketing performance template business owners and marketers can quickly identify how the different acquisition channels are driving traffic and conversion values.
It helps marketers quickly compare which channels perform best.
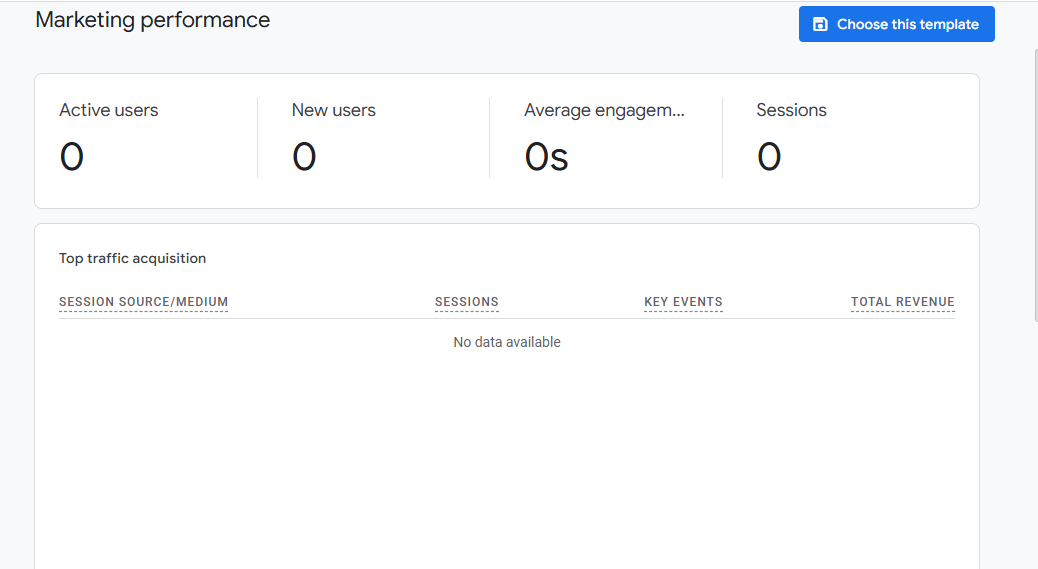
Metrics in the marketing and performance template
Active users - activeUsers
New users - newUsers
Average engagement time per active user - activeUsers, userEngagementDuration
Sessions - sessions
Key events - keyEvents
Total revenue - totalRevenue
Dimensions in the marketing performance template
Session source/medium - sessionSourceMedium
First user source/medium - firstUserSourceMedium
Session Google Ads campaign - sessionGoogleAdsCampaign
Session Google Ads Ad group name - sessionGoogleAdsAdGroupName
Session Google Ads keyword text - sessionGoogleAdsKeywordText
Session Google Ads query - sessionGoogleAdsQuery
Session Google Ads ad network type - sessionGoogleAdsAdNetworkType
session Google Ads account name - sessionGoogleAdsAccountName
Conclusion
GA4 report snapshots and templates give you a quick view of how users find you, what they do and where revenue comes from. Once you know the dimensions and metrics behind each card, you can customise the reports to answer your own business questions.
To pull the same data automatically, see our Google Analytics report template with 10 key metrics and our guide to building a GA4 AI agent with MCP.
If you would rather just ask questions in plain English, try the Agentzee analytics agent.