
You’ve spent three weeks building the campaign. The creative is sharp. The copy went through four rounds of edits. You hit publish, check back 48 hours later, and Facebook tells you your ad has “good delivery”. Great. But your cost per result has quietly climbed to $38, your ROAS is sitting at 0.9, and you’ve essentially been paying Facebook to fund a very expensive lesson.
This is where most marketers go wrong. They optimise for Facebook’s highlighted metrics (reach, impressions, post engagement) and ignore the ones that actually determine whether the campaign is working. Facebook ad analytics isn’t short of data. The problem is knowing which numbers to care about.
Here are the 10 metrics that matter in Facebook ad analytics.
Top 10 metrics for Facebook ad analytics
Click Through Rate
Cost Per Click
Link Click Through Rate
Return On Ad Spend
Cost Per Result
Cost Per Mille
Conversions
Frequency
Quality Ranking
Impressions
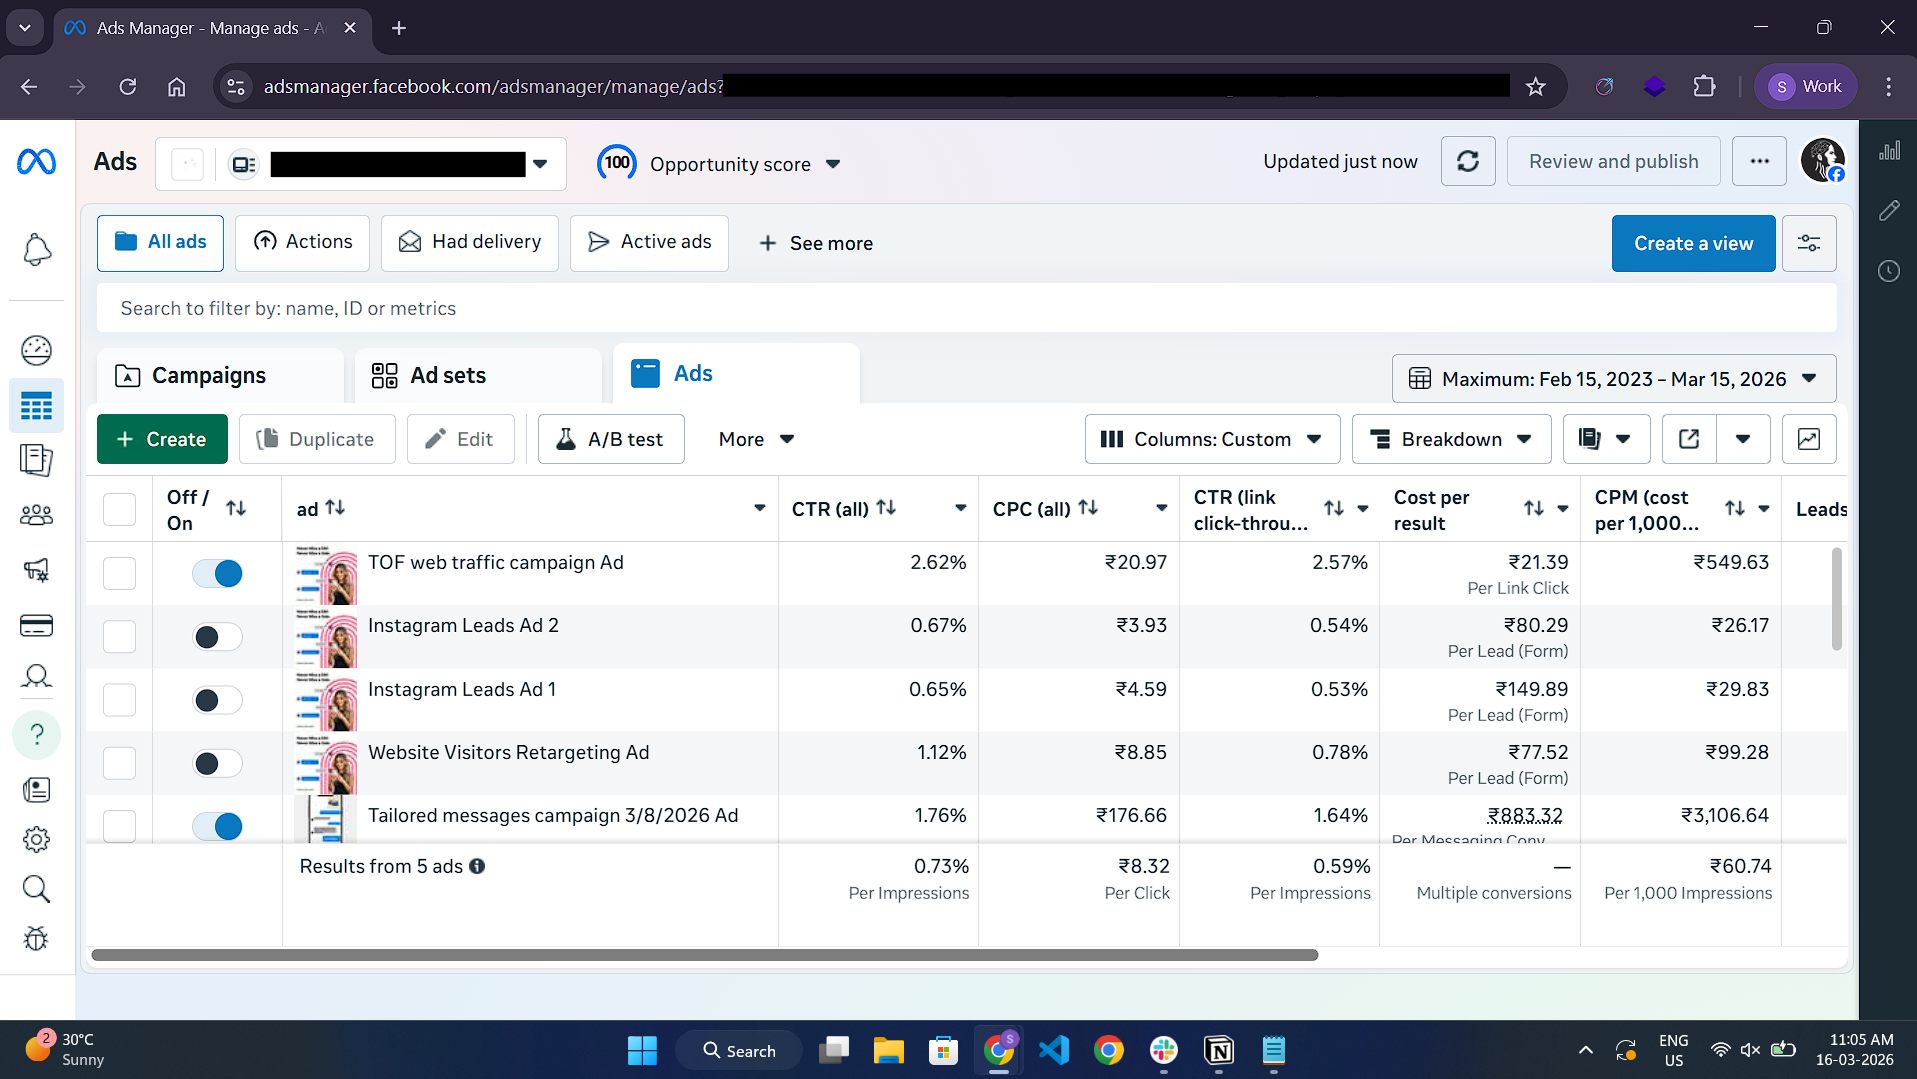
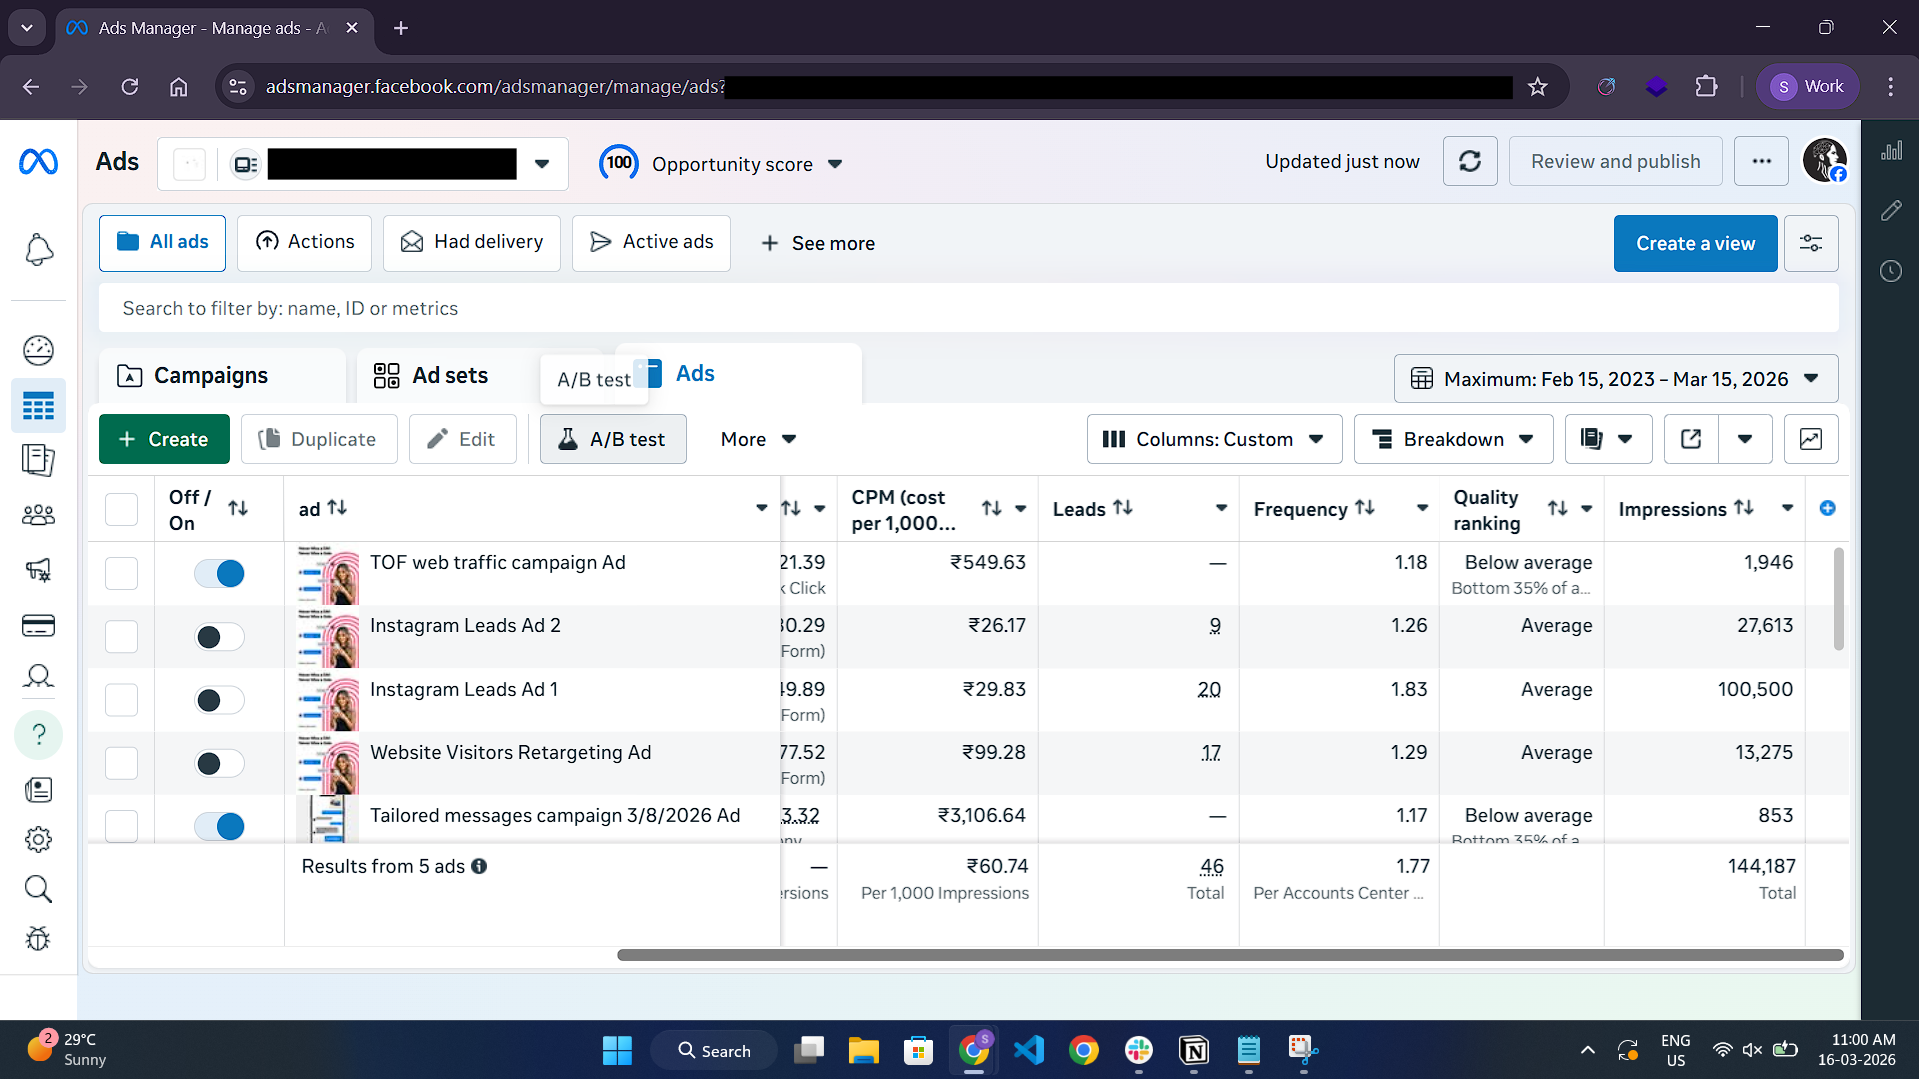
The metric shown in the Facebook ads analytics manager dashboard:
The API for getting the above-mentioned top 10 metrics:
GET https://graph.facebook.com/v24.0/<AD_ID>/insights
?fields=ad_id,ad_name,ctr,cpc,inline_link_click_ctr,purchase_roas,cpm,cost_per_action_type,
frequency,quality_ranking,engagement_rate_ranking,conversion_rate_ranking,conversions,
impressions&access_token=<ACCESS_TOKEN>
Example Output for this API
{
  "data": [
    {
      "ad_id": "238500111222333",
      "ad_name": "Lead Generation Video Ad",
      "ctr": "2.95",
      "cpc": "2.40",
      "inline_link_click_ctr": "2.30",
      "purchase_roas": [
        {
          "action_type": "purchase",
          "value": "5.40"
        }
      ],
      "cpm": "70.80",
      "cost_per_action_type": [
        {
          "action_type": "lead",
          "value": "93.56"
        },
        {
          "action_type": "purchase",
          "value": "251.88"
        },
        {
          "action_type": "link_click",
          "value": "3.08"
        }
      ],
      "frequency": "1.78",
      "quality_ranking": "ABOVE_AVERAGE",
      "engagement_rate_ranking": "AVERAGE",
      "conversion_rate_ranking": "ABOVE_AVERAGE",
      "conversions": [
        {
          "action_type": "purchase",
          "value": "52"
        },
        {
          "action_type": "lead",
          "value": "140"
        }
      ],
      "impressions": "185000",
      "date_start": "2026-02-10",
      "date_stop": "2026-03-11"
    }
  ]
}
Facebook ad analytics starts with click behaviour.
1. Click-through rate
Click-through rate or CTR is nothing but the percentage of people who saw the ad and clicked on it. In Facebook ad analytics, CTR is one of the earliest indicators of whether your creative and targeting are working.
It is calculated using the formula.
CTR = (Clicks / Impressions) x 100The general industry benchmarks for Facebook feed ads tend to sit between 0.9%-1.5%, and these numbers can vary greatly by industry.
CTR below 0.5% means one of two things: your audience targeting is off, or your ad isn’t compelling enough to stop the scroll.
2. Cost per click
Cost per click or CPC indicates how much you pay for each click. It can be calculated using the simple formula:
CPC = Spend / ClicksLow CPC sounds great until you realise those clicks aren’t converting. That said, a rising CPC is often a signal of audience fatigue, i.e., you’ve shown the same ad to the same people too many times.
3. Link click-through rate
Link click-through rate (also called “inline link click-through rate”) measures the percentage of people who clicked the link inside your ad that leads to the external destination (like your website or app). It does not include all the clicks (likes, comments, links, etc.), like CTR. It is calculated using a formula.
Inline Link CTR = (Inline Link Clicks / Impressions) × 100In Facebook ad analytics, this metric is often more valuable than CTR because it measures real traffic intent. This metric is a clear sign of intent; someone didn’t just react to the ads, they wanted to know more.
The Facebook ad analytics metrics that track real money
4. Return on ad spend
ROAS is the revenue earned for every dollar you spend on Facebook ads. For example, a value for purchase_roas 5.40 means you have earned $5.40 for every $1 spend on the ads. Within Facebook ad analytics, ROAS is considered the ultimate profitability metric.
Your break-even ROAS depends entirely on your margins. A 2.5x ROAS might be excellent for a high-margin SaaS product and catastrophic for a business with thin margins. Always calculate your minimum viable ROAS before the campaign goes live. Otherwise, you’re optimising blind.
5. Cost per result
In Facebook ad analytics, the word “result” means a purchase, a lead, a link click, or an app install.
Cost Per Result, or CPR, is how much you have spent to get one of those. It’s one of the most direct ways to evaluate a campaign’s efficiency.
It is calculated using the formula:
CPR = Total spend / Number of ResultsIf your CPR is trending up week over week, either your audience is saturating or your offer isn’t resonating. Usually both
6. Cost per mille
Cost per mille or CPM measures cost per 1000 impressions. The formula for the CPM is given below:
CPM = (Spend / Impressions) x 1000In Facebook ad analytics, CPM is often used to understand auction competition and audience demand.
This metric doesn’t tell you about the conversions, but it tells you a lot about competition. High CPM means you are operating in a crowded auction.
Conversion side of Facebook ad analytics
7. Conversion
It is a measure of the people who clicked your ad and then completed the desired action on your landing page. A conversion may be from purchase, lead form submission, app install, signup, or add to cart. With this, we can calculate the conversion rate using the formula
Conversion Rate=(Conversions / link click) ×100Facebook doesn’t have an API for conversion rate, so many Facebook ad analytics workflows calculate it manually using click and conversion data.
A low conversion rate with a healthy CTR is rarely a Facebook ad problem; it is a landing page problem. The ad did its job, but the page didn’t
The Facebook ad analytics metrics that track the number of audience
8. Impressions
Impressions records the total number of times your advertisement appears on the screen. Users have three options: click, ignore, or scroll past the ad.
It’s a volume metric that, when combined with other metrics, can actually be useful.
A high number of impressions and a low CTR mean that your ad is being shown but not being engaged with by your audience.
9. Frequency
Frequency is the average number of times a single person has seen your ad. It is calculated using the formula.
Frequency = Impressions / ReachIf it’s above 3 or 4 in a short space of time, it’s a warning sign. The performance will generally start to dip, the CPM will start to rise, and you’ll begin to get the type of “why do I keep seeing this?” comments that do absolutely nothing for your brand. If the frequency is going up, it’s probably time to rotate the creative or the audience.
One metric marketers overlook in Facebook ad analytics
10. Quality, engagement and conversion rankings
Facebook replaced its single relevance score with three diagnostic rankings.
Quality Ranking
Engagement Rate Ranking
Conversion Rate Ranking
Each compares your ad’s performance against other ads competing for the same audience. “Below average” on any of these is Facebook’s polite way of saying your ad isn’t earning its place in the auction.
Conclusion
Tracking these 10 metrics individually is useful. A high CTR with a low conversion rate means you have a landing page issue. A low CTR with a low CPC means you may be targeting a market that is easy to reach but hard to convert. A low ROAS with a high quality ranking means you have an offer issue, not a targeting issue.
Facebook ad analytics has all the data you need. The trick is to know what to read together to take action quickly before you spend all your ad budget.
Most marketers don’t fail on Facebook because they lack data. They fail because they’re looking at the wrong data and celebrating reach while their ROAS quietly bleeds out, or panicking over CPM spikes that are just seasonal noise.
The 10 metrics discussed here won’t guarantee an overnight success for your campaign. What they will guarantee is that you’re asking the right questions at the right time. Is the creative working? Is the audience saturated? Is the landing page killing conversions that the ad earned? The answers are already in your Ads Manager; you just need to know where to look.
If you want to stop manually stitching these metrics together from five different dashboards, Agentzee can automate your Facebook ad analytics reporting workflows so you spend less time pulling numbers and more time making decisions with them.
To streamline your Facebook ad analytics and make faster, data-driven decisions, explore our analytics agent today.