
Arrive at the Raja’s location. He produces custom faux-leather purses in his home workshop in Coimbatore and sells them on social media.
Weekly, for five days, he posts the product on the Instagram page. He takes the real photos he takes by himself and adds captions; he spends 30 minutes writing them. He replies to every single comment manually. His profile looks wonderful. His products are truly good.
One night, after spending three hours working on a reel that received only 118 views, Raja sat back and typed this into Google:
“How to view Instagram analytics.”
Without Instagram analytics, if you are posting constantly but not seeing consistent growth. Learning how to view Instagram analytics can entirely change your posting approach. Instead of predicting the post-insights and engagement work, you start making decisions based on current numbers.
The Instagram post has not reached.
The problem is found. That single search for how to view Instagram analytics changed everything.
Within two weeks of actually looking at his data, not guessing, and actually reading the numbers Instagram already gives you for free, here is what Raja discovered:
His audience was most active at 8 pm. He had been posting at 10 am every day; this is a major problem.
His product close-up photos got 6x more saves than his lifestyle photos.
One specific hashtag was delivering 50% of all his new page arrivals.
His stories had a 60% quit rate after the second slide; people were leaving fast.
He did not change his items. He did not spend earnings on advertisements. He just looked at the data that was already there and made four small changes based on what he read.
Sales from Instagram increased by 40% the following month.
This blog is for every Raja out there. An individual who is posting regularly but not seeing outcomes. You just need to know where to look.
This Instagram analytics helps to improve the reach and growth after viewing the top 10 Instagram analytics.
This is the solution for an actual Instagram account to enhance your Instagram account’s impression and fast growth. You need to focus on these most important metrics inside (Reels, video, and carousel) the Instagram analytics Graph API:
First, concentrate on boosting your engagement speed, and your Instagram page will experience faster growth.
Next, to checking the view Instagram analytics, having the most important metric to enhance focus on Reach and engagement is by posting consistently and communicating interesting content like carousel and reels posts. Also, pay close attention to share and save the metric, both of which strongly boost your page reach. To improve your profile traffic, note powerful captions, website clicks, and clear calls to action. It gets more engagement.
How to view Instagram analytics to improve insights.
Step 1: The Meta account gets a valid access token for the Instagram Graph API.
The first step to access the Instagram Analytics Graph API is to get a valid access token from the Meta account.
You are struggling with creating an app and generating tokens. Visit the blog to generate the Access Token. Generated Access Token after completing this first step. Continue with the next step.
Step 2: How to operate and recover the analytics data using the Instagram Graph API.
The correct approach is the Instagram analytics API. This workflow is an approved method to fetch the analytics data from our Instagram Insights API.
Get insight data by using the insights endpoint:
GET https://graph.instagram.com/v23.0/{media-id}/insights?metric=profile_views,website_clicks,
reach&access_token={access-token}
Real example looking with insights and ID:
GET https://graph.instagram.com/v23.0/17841475906304645/insights?metric=profile_views,
website_clicks,reach&access_token={access-token}
This is my Instagram sample insights response, and it seems like this:
{
    "data": [
        {
            "name": "profile_views",
            "period": "day",
            "title": "Profile visits",
            "description": "The number of times that your profile was visited.",
            "total_value": {
                "value": 0
            },
            "id": "17841475998304645/insights/profile_views/day"
        },
        {
            "name": "website_clicks",
            "period": "day",
            "title": "Website link taps",
            "description": "The number of times that the link to your website was tapped.",
            "total_value": {
                "value": 0
            },
            "id": "17841475998304645/insights/website_clicks/day"
        },
        {
            "name": "reach",
            "period": "day",
            "title": "Accounts reached",
            "description": "The number of unique accounts that have seen your content,
            at least once, including in ads. Content includes posts, stories, reels, videos
            and live videos. Reach is different from impressions, which may include multiple
            views of your content by the same accounts. This metric is estimated and in
            development.",
            "total_value": {
                "value": 0
            },
            "id": "17841475998304645/insights/reach/day"
        }
    ],
    "paging": {
        "previous": "https://graph.facebook.com/v23.0/17841475998304645/insights?access_token=YOUR_ACCESS_TOKEN&metric=profile_views%2Cwebsite_clicks%2Creach&metric_type=total_value&period=day&since=1770961256&until=1771134056",
        "next": "https://graph.facebook.com/v23.0/17841475998304645/insights?access_token=YOUR_ACCESS_TOKEN&metric=profile_views%2Cwebsite_clicks%2Creach
        &metric_type=total_value&period=day&since=1771306858&until=1771479658"
    }
}
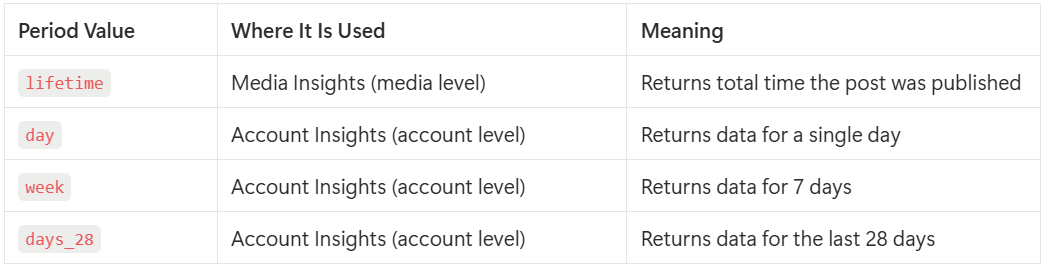
Step 3: Another important thing you need to know is how to use the period parameter in the Instagram Graph API:
Period parameter representing the “How long should I calculate this metric?”
First, the top 10 Instagram analytics in terms of media level and account level are available. The first level is media-level analytics views, likes, comments, saves, story analytics, and reach; use the media ID API, and set periods to lifetime.
But the reach media level and account level are available in the Instagram Graph API, which I explained in the content below.
Next, coming to the account-level analytics, account reach, followers growth, and bio link clicks; for this account level, use the user ID and periods set to day, days_28, and week.
Step 4: Use the top 10 Instagram analytics to enhance your Instagram reach and growth faster.
Yes, each metric conveys a completely different way. Likes tell you about content appeal. Saves tell you about content value. Share tells you the important content. Comments tell you about emotional response. Reach tells you about trending content. The profile view tells about attraction.
So we’re going to assemble each one separately. To view the ten Instagram analytics for our page.
Fields and Parameters (Metric)
The top 10 metrics that we are going to analyse.
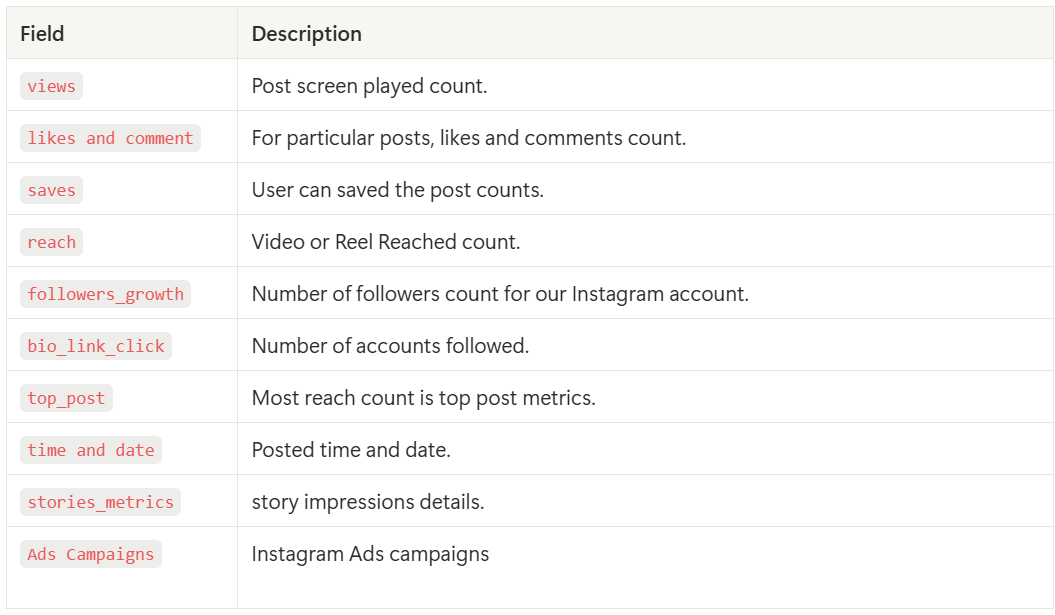
1) Views
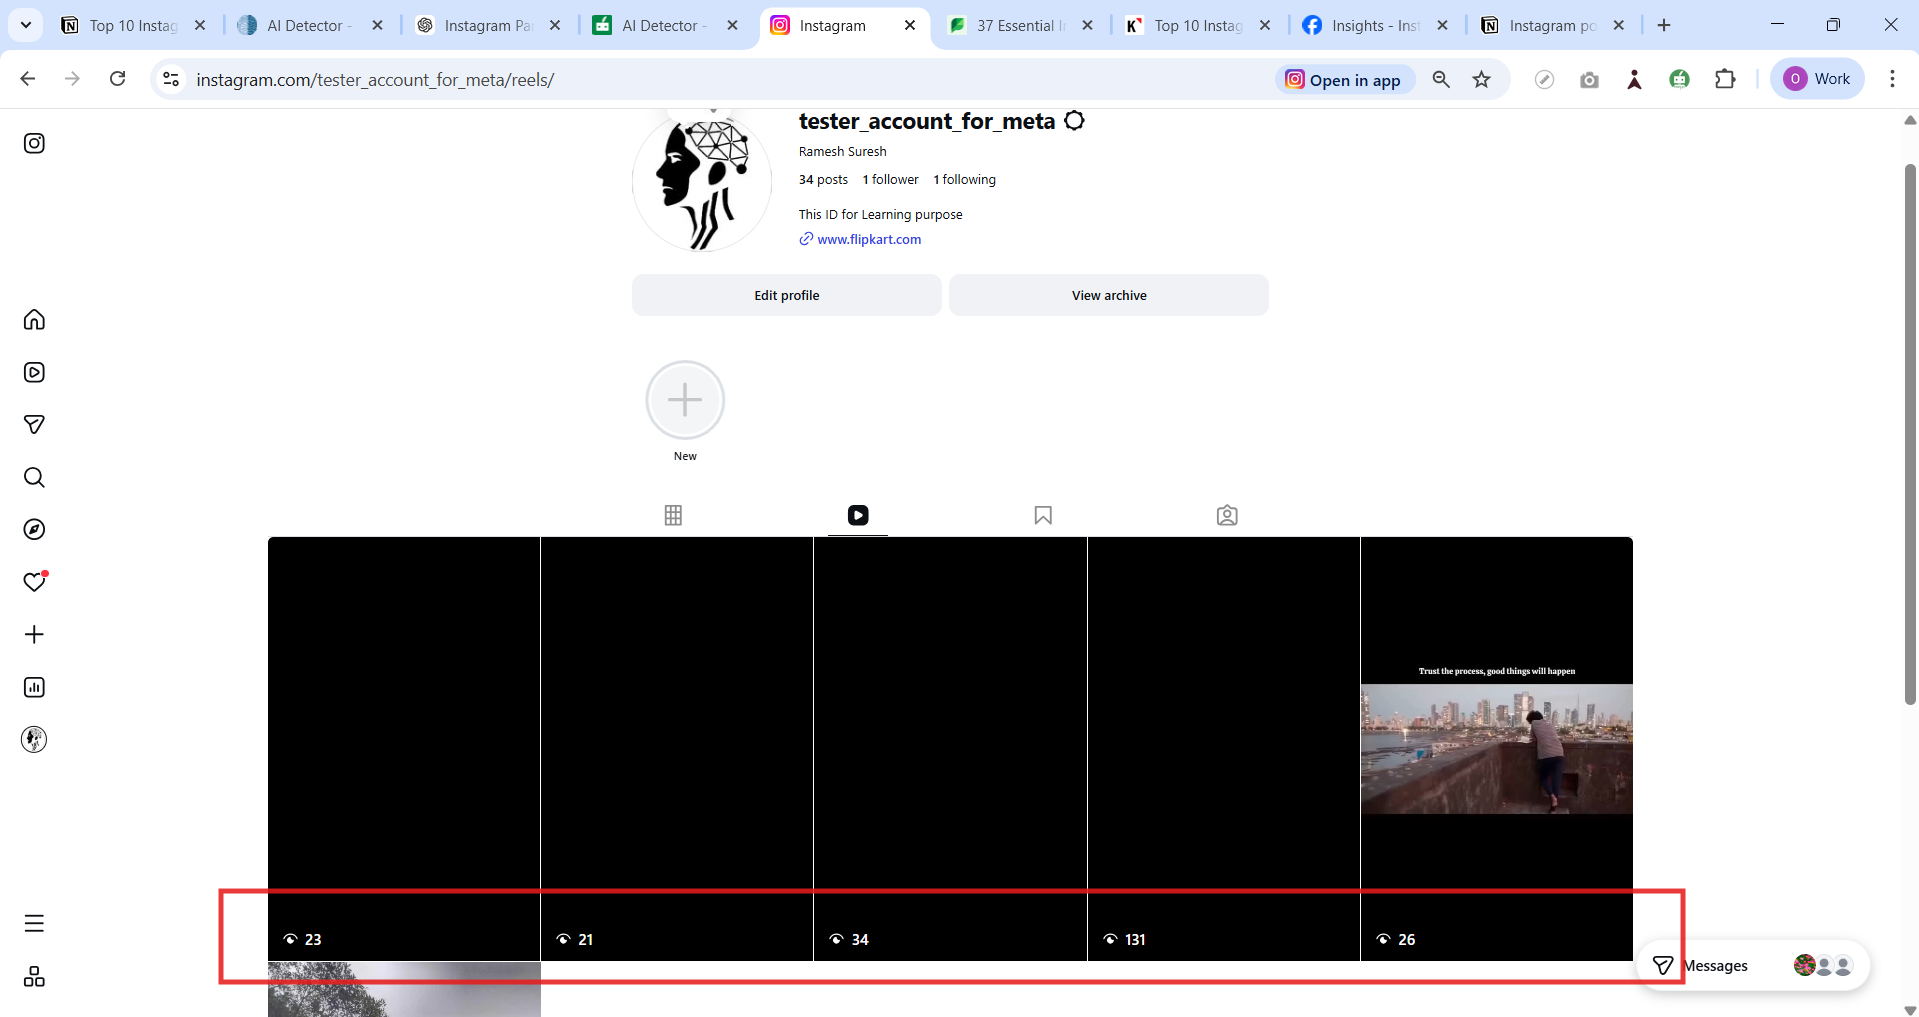
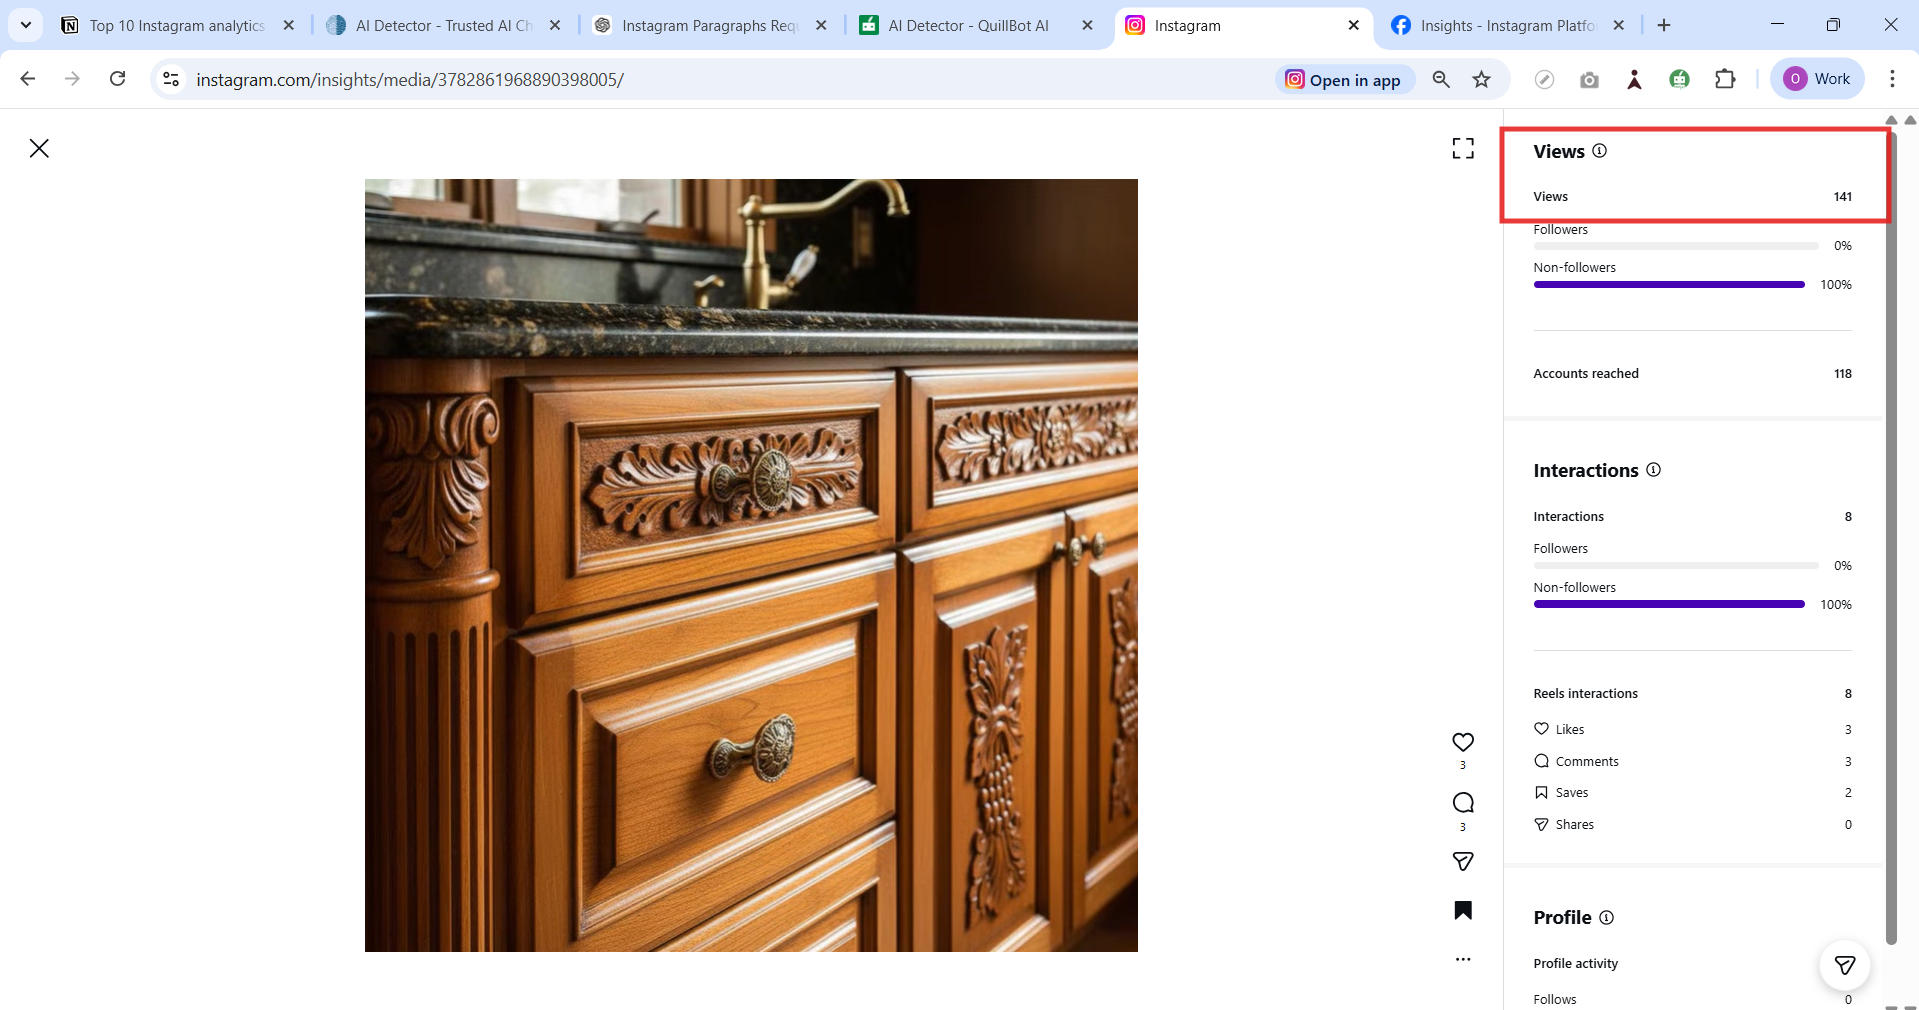
View insights representing your real playing number and the number of times played in the user display. This is the major metric used to analyse all organic and promoted media on Instagram. The ‘plays’ metric is being taken out and renamed ‘views.’
Endpoint for retrieving the view count
GET https://graph.facebook.com/v23.0/{ig-media-id}/insightsExample endpoint:
GET https://graph.facebook.com/v23.0/17895695668004550/insights?metric=views&period=lifetime
&access_token=YOUR_ACCESS_TOKEN
Sample Response:
GET https://graph.facebook.com/v23.0/17895695668004550/insights?metric=views&period=lifetime
&access_token=YOUR_ACCESS_TOKEN
Sample Response:
{
  "data": [
    {
      "name": "views",
            "period": "lifetime",  day, week, 28 days
            "title": "Accounts reached",
            "description": "The number of unique accounts that have seen your content,
            at least one.",
            "total_value": {
                "value": 118
            },
            "id": "17841475998304645/insights/views/lifetime
      ]
    }
  ]
}
2) Likes and Comments
People like your post. It’s the more basic form of engagement on Instagram. It shows that the user noticed your content. They appreciated and enjoyed it. The post-outcome is reacted to positively. But it’s just one click. But comments are not like that; they are a very noteworthy attraction on the Instagram page. Once people enjoy the reel or video, they start thinking, typing, and commenting. So the reason is strong engagement, and the audience is personally a contributor.
Endpoint for recovering the likes and comments count
GET https://graph.facebook.com/v23.0/{media-id}?fields=like_count,comments_count&period=lifetime
&access_token=ACCESS_TOKEN
The likes and comments are direct output:
{
    "id": "17841475918304645",
    "username": "tester_account_for_meta",
    "followers_count": 1,
    "follows_count": 1,
    "media": {
        "data": [
            {
                "id": "18204722800325303",
                "caption": "balaji saab",
                "media_url": "https://scontent.cdninstagram.com/v/t51.82787-15/632467336_n.jpg?
                stp=dst-jpg_e35_tt6&_nc_cat=108&ccb=7-5&_nc_sid=18de74&efg=eyJlZmdfdGFnIjo
                iRkVFRC5iZXN0X2ltYWdlX3VybGdlbi5DMyJ9&_nc_ohc=sea-HiFhk9kQ7kNvwFINYKT&_nc_
                oc=AdlCc42QBipHhp1r01pJNiIzq86kgdOdmPuqPCbKEaF0tl_IEPuTW33ebM8u1I8jFeM&_nc_
                zt=23&_nc_ht=scontent.cdninstagram.com&edm=AL-3X8kEAAAA&_nc_gid=Mfc0tI3RhlTG
                yKPAKXTG9A&oh=00_AfveyvObD5sLGo_sy0IEDwlT5gjmeuaSj8qXoO77-Ezq2Q&oe=6998D5C8",
                "media_type": "IMAGE",
                "like_count": 200,
                "comments_count": 30,
                "timestamp": "2026-02-16T12:13:51+0000"
            }
        ]
    }
}
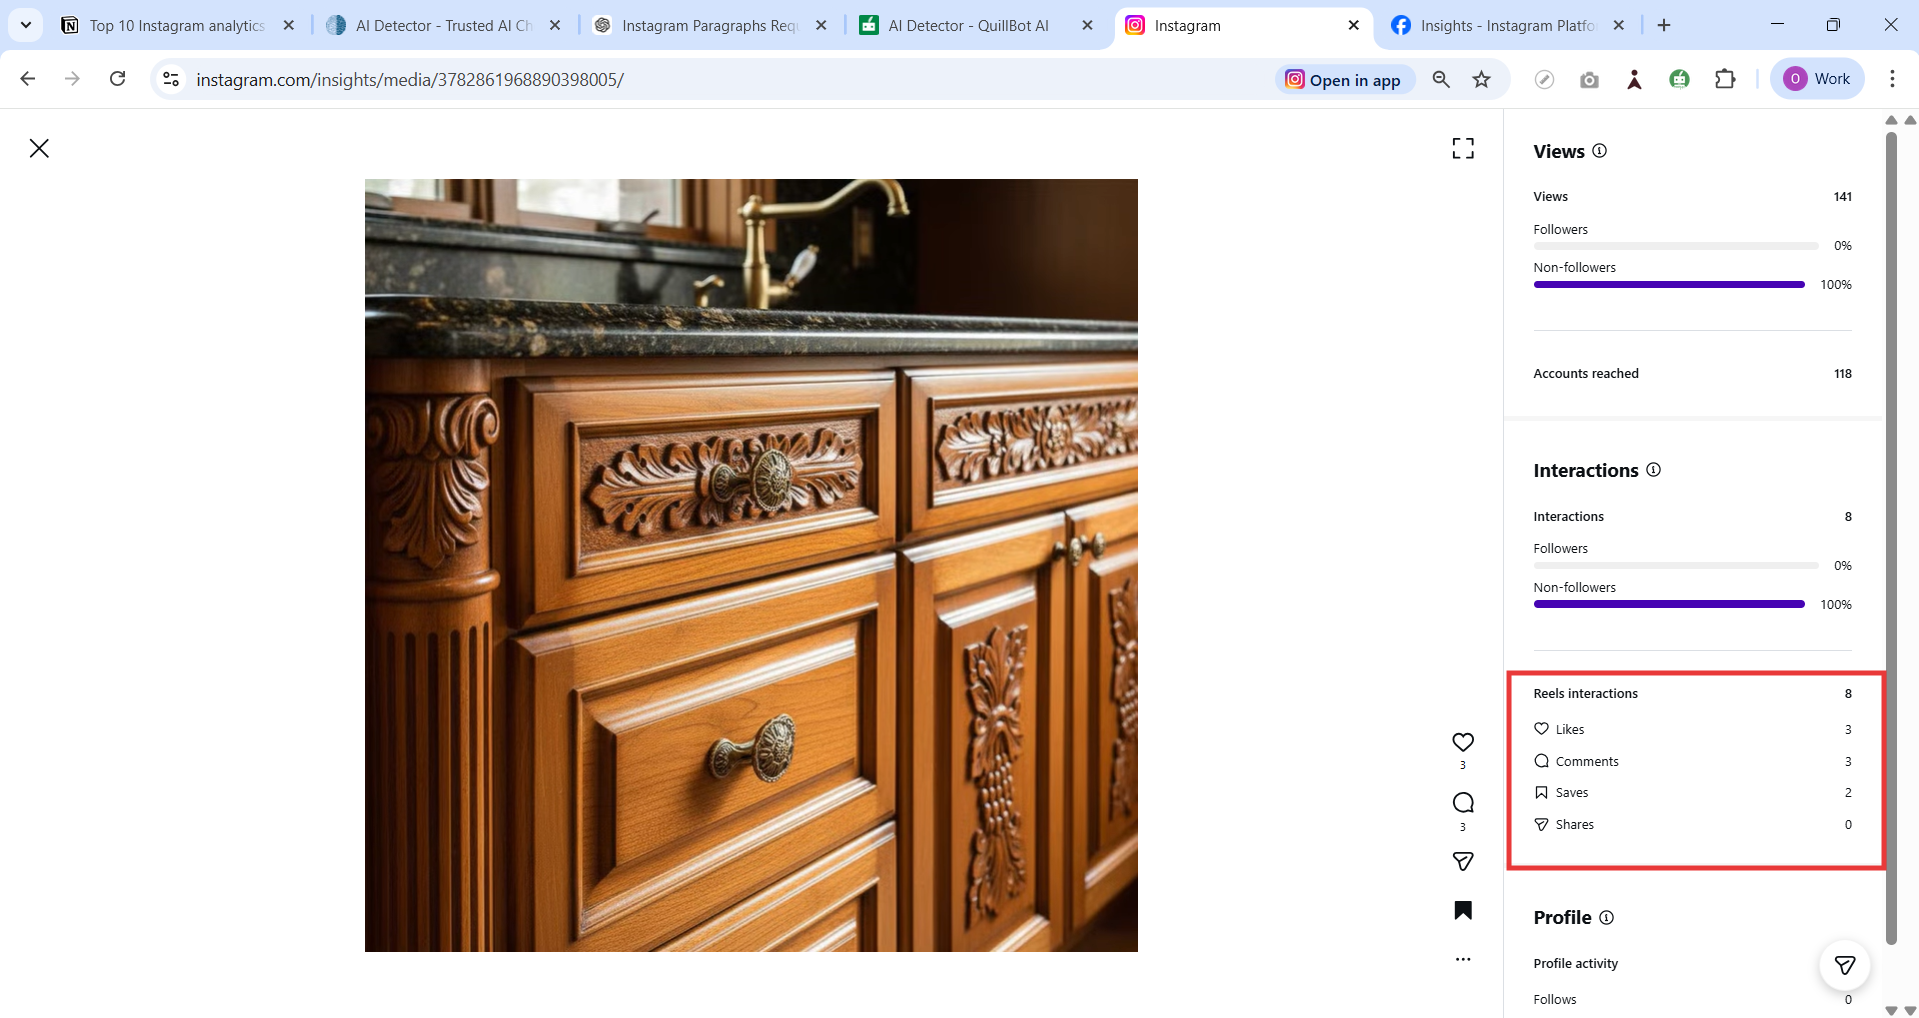
3) Saves
Saved analytics is very important because it is good engagement. Once an Instagram user gets good knowledge, they will bookmark your post to view later; this metric helps to calculate useful content, so this is powerful engagement for Instagram analytics. Every week, monitor the saves to gain insight data for improving your content’s strength.
When someone saves any post, it is useful content with strong agreement, but after it is around, it is met with questions.
Endpoint for saved analytics:
GET https://graph.facebook.com/v23.0/{media-id}/insights?metric=saved&period=lifetime
&access_token=ACCESS_TOKEN
Sample Response for Saved analytics
{
  "data": [
    {
      "name": "saved",
      "period": "lifetime",
      "values": [
        {
          "value": 87
        }
      ],
      "title": "Saves",
      "description": "Total number of saves of the media object"
    }
  ]
}
4) Reach
Reach analytics measures audience exposure and shows the unique accounts that have seen your content. Reach helps you to understand the post visibility. You retrieve the reach metric from the Instagram Graph API; it works in a good and secure way. It does not measure the total impression.
This endpoint returns the reach for ONE specific post/reel
GET https://graph.facebook.com/v23.0/{MEDIA_ID}/insights?metric=reach&period=lifetime
&access_token=ACCESS_TOKEN
It mostly returns the lifetime periods only
{
  "data": [
    {
      "name": "reach",
      "period": "lifetime",
      "values": [
        {
          "value": 2540
        }
      ],
      "title": "Reach",
      "description": "Number of unique accounts that saw this post"
    }
  ]
}
Endpoint for account-level reach
GET https://graph.facebook.com/v23.0/{ig-user-id}/insights?metric=reach&period=day
&access_token=ACCESS_TOKEN
Sample Response for account-level reach
{
  "data": [
    {
            "name": "reach",
            "period": "day",
            "title": "Accounts reached",
            "description": "The number of unique accounts that have seen your content,
            at least once, including in ads. Content includes posts, stories, reels,
            videos and live videos. Reach is different from impressions, which may include
            multiple views of your content by the same accounts. This metric is estimated
            and in development.",
            "total_value": {
                "value": 0
            },
            "id": "17841475158304645/insights/reach/day"
     }
  ]
}
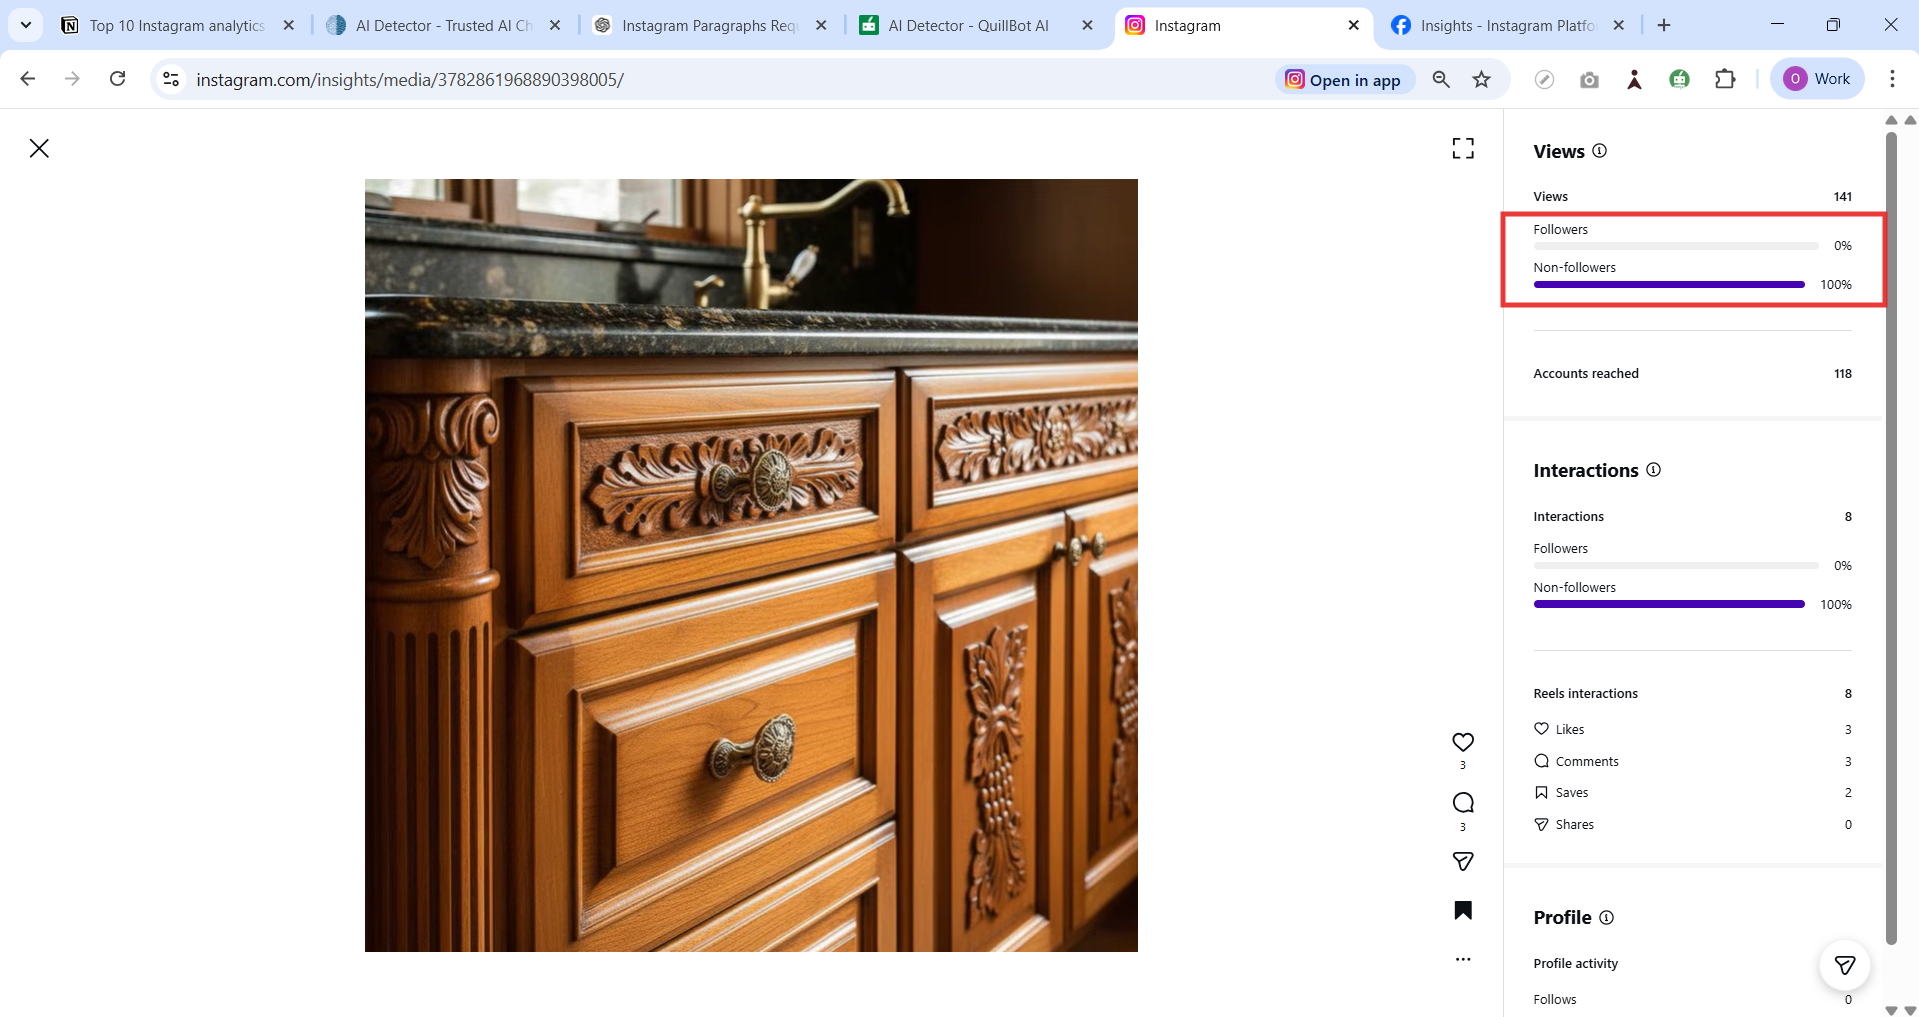
5) Followers Growth
The follower analytics help to track the regular follower and unfollower count. Follower growth analytics show your audience increases or decreases during a period. This metric is useful for account growth and identifying a strong content approach. Likewise, it can determine followers’ growth trends using the Instagram analytics Insights API, and the follower count data is available for business accounts only.
Endpoint for retrieving the Instagram Followers Growth
GET https://graph.facebook.com/v23.0/{ig-user-id}/insights?metric=follower_count&period=day
&access_token=ACCESS_TOKEN
Sample Response for Follower Growth
{
  "data": [
    {
      "name": "follower_count",
      "period": "day",
      "title": "Follower Count",
      "description": "Total number of followers for the Instagram account",
      "values": [
        {
          "value": 1520,
          "end_time": "2026-02-26T07:00:00+0000"
        }
      ]
    }
  ]
}
6) Bio Link Click
Bio link clicks measure traffic from your Instagram account and show how many users tag the link. This metric helps to measure the tracking of website or homepage visits. High bio-click performance, a strong active call. Using the website Clicks Insights tracks the Instagram analytics graph API. Its API is available only for business accounts.
Endpoint to retrieve the Bio Click analytics:
GET https://graph.facebook.com/v23.0/{ig-user-id}/insights?metric=website_clicks&period=day
&access_token=ACCESS_TOKEN
Sample Response for Bioclick:
{
  "data": [
    {
            "name": "website_clicks",
            "period": "day",
            "title": "Website link taps",
            "description": "The number of times that the link to your website was tapped.",
            "total_value": {
                "value": 0
            },
            "id": "17841475198304645/insights/website_clicks/day"
        }
    ]
}
7) Top Post
Top posts give you analytics into the types of posts that are performing best on your track. These can be organised using different metrics. Top post by number of likes, comments, top post by impressions, top post by number of shares, whatever best encapsulates your goals. Posts are one of Instagram’s “essential elements,” the videos, photos, and captions that appear in users’ feeds.
The top post is equal to the Reach insights post, which post gets more reach, and also measures the Top post insights.
Note: * There is no direct access to the top media API
1) First step, you must:
GET https://graph.facebook.com/v23.0/{ig-user-id}/media?fields=id2) Second step for each media
GET https://graph.facebook.com/v23.0/{MEDIA_ID}/insights?metric=reach&period=lifetime3) third next, compare the reach values
Highest reach = Top post
Sample Response for engagement
{
  "data": [
    {
      "name": "reach",
      "period": "lifetime",
      "title": "Reach",
      "description": "Total number of unique accounts that have seen the media object",
      "values": [
        {
          "value": 5420
        }
      ]
    }
  ]
}
8) Posting Time and Day
Posting time-based analytics helps you to measure where the audience is most active on the Instagram page. It measures which days your followers are online the most, and it helps to choose the best time to post the content on your page.
Choosing the peak time after publishing the content can increase the reach and engagement. You can analyse the daily followers’ activity and improve your content scheduling period. This wonderful API is present in the Instagram Graph API.
Endpoint for posting time and day analytics
GET https://graph.facebook.com/v23.0/{ig-user-id}/insights?metric=audience_online_followers
&period=lifetime&access_token=ACCESS_TOKEN
Sample Response for posting time and day
{
  "data": [
    {
      "name": "audience_online_followers",
      "period": "lifetime",
      "title": "Most Active Times",
      "description": "Number of followers online during specific hours",
      "values": [
        {
          "value": {
            "0": 120,
            "1": 48,
            "2": 85,
            "3": 50,
            "4": 50,
            "5": 80,
            "6": 120,
            "7": 420,
            "8": 580,
            "9": 610,
            "10": 800,
            "11": 880,
            "12": 950,
            "13": 890,
            "14": 760,
            "15": 690,
            "16": 720,
            "17": 850,
            "18": 990,
            "19": 1150,
            "20": 1050,
            "21": 970,
            "22": 600,
            "23": 400
          }
        }
      ]
    }
  ]
}
9) Stories metrics
Stories are a big part of Instagram these days. Story measures the number of times users can view your stories. And with features such as ads and links, it’s more comfortable than ever for associations to make use of stories to connect with their target audiences(users).
A story helps to give you a unique idea to enhance your page and how users are interacting with your story’s content. That information can be put to work in making optimizations and modifications. That way, you can deliver the types of content that will resonate most with your audience(users).
Endpoint for Stories metric
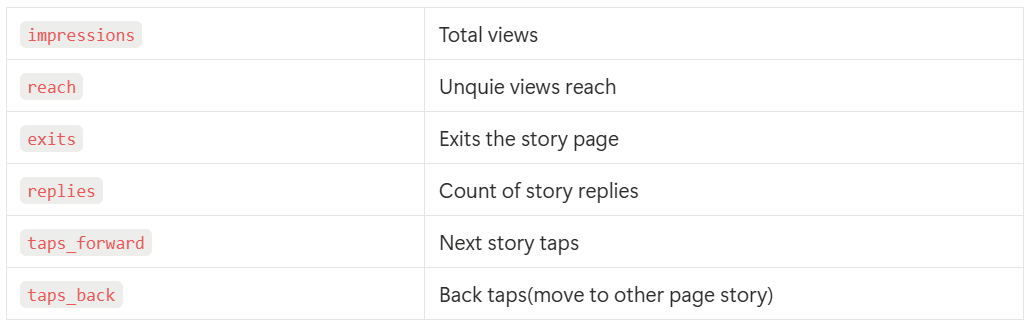
GET https://graph.facebook.com/v23.0/{story-media-id}/insights?metric=views,reach,replies,navigation&period=lifetime&access_token=ACCESS_TOKENNote: Meta has deprecated impressions and the older story metrics (exits, taps_forward, taps_back) in recent API versions. Use views instead of impressions, and the navigation metric (with the story_navigation_action_type breakdown) for taps and exits.
Metric for Instagram Story
Sample Response for Story metrics
{
  "data": [
    {
      "name": "views",
      "period": "lifetime",
      "values": [{ "value": 1250 }]
    },
    {
      "name": "reach",
      "period": "lifetime",
      "values": [{ "value": 1100 }]
    },
    {
      "name": "navigation",
      "period": "lifetime",
      "values": [{ "value": 85 }]
    },
    {
      "name": "replies",
      "period": "lifetime",
      "values": [{ "value": 24 }]
    }
  ]
}
10) Ads Campaigns
This Ads Campaigns refers to the Instagram business promotion content using their product. You can check Instagram ad analytics in a few ways, including Ads Manager and measuring the Instagram ads to clickthroughs from ad impressions, which helps you to stay on top of one of the key reasons for running ads on the Instagram platform. It allows us, based on age, gender, location, and user interests, to find out the specific users. Finally, ad campaigns are one of the best ways to improve our product on social media platforms.
These are the simple tips to get more engagement for your Instagram Page.
Post the content when followers are active on the page.
When posting the content, the timing should be from 6 PM to 8 PM.
Enhance your first 4-second attraction content or creative.
Take stronger pictures for posting the content.
Add emotional indications. Use trending layouts (Reels). To view the Instagram analytics API is present in the Instagram Graph API.
How to view Instagram analytics for your Instagram posts. whether images, videos, or reels. It’s just a few easy steps; I explained in the previous section how you can retrieve your insights without wasting time. There are no complicated system setups, just fast implementation and smooth, hassle-free automation.
This top 10 Instagram analytics product does not work for one individual’s effort; it is a strong team collaboration. Every member contributes their ideas and dedication. We have successfully executed this workflow in our outcome. Want to check your Instagram analytics and improve your Instagram page more efficiently? We have already simplified this whole working process on our website Agentzee Workflow. Feel free to give it a try.
Conclusion
How to view Instagram analytics, content insights data collection, and build a powerful Instagram analytics tool. This Instagram analytics helps to measure the businesses and creators’ accounts. You can clearly see, using the top 10 Instagram analytics, which posts get the most reach, and how to increase the page traffic.
Measuring the analytics allows you to make more intelligent decisions making rather than guessing your design. By checking to view Instagram analytics metrics regularly, analysing the post engagement is essential for building a strong post and success on the platform.
If you need to set up the Instagram automation through the Agentzee platform, we have already implemented this workflow. To integrate our Instagram automation agent into your existing business and improve efficiency and productivity.
Check out our product.