
In the present-day smart digital learning generation, they open their textbooks and highlight the theory. Still, online learning has 47 tabs open. Your notes look like a novel. From long PDFs to lengthy theory essays, most educational material is heavily text-based.
But the problem is here.
Reading long paragraphs of theory is difficult, and understanding complex concepts from plain text is not easy. When learning the raw theory, it takes more time, and it is hard to learn and remember that information later. Even harder.
So what’s the solution for this?
Instead of reading the textbook and boring text content, convert it into an entertaining visual AI infographic generator from text and text-to-image automatically using
System Prompt
User Prompt
Python Script
Input Text
Output Infographics Image AI infographic generator from text.
Is the real problem studying difficult theoretical concepts online and in textbooks?
Using online, unlimited learning knowledge anytime and anywhere. This good thing.
But in practice? Most of the pages have text content and theory PDFs for the online learners, giving them this.
The result: You learn and understand the whole thing, but only 40% of it, and forget 60% of the concepts; for this, it takes more time to learn.
The AI infographic generator from text fixes it. This AI infographic breaks complex concepts into an infographic image. It’s like a workflow design image using flow, colour, shape, icons, emoji, images, and text (user-relevant) so your brain understands and picks it up easily. You’re saving the learning time and avoiding studying difficulties.
At the same time, you can design the infographics for every concept; you need design skills, and it takes more time
So what’s the resolution?
AI infographic generator from text image, using a Python script and gemini as a solution.
Instead of text content, a paragraph essay, or an infographic image.
For this, what if you need to paste a block of text, run a Python script, and get a clear infographic image back in seconds?
No subscription. No Pro. No Canva designer. No Figma designer.
Just use your block of text and Gemini APIs and run a Python script doing the light work and making complex concepts easy.
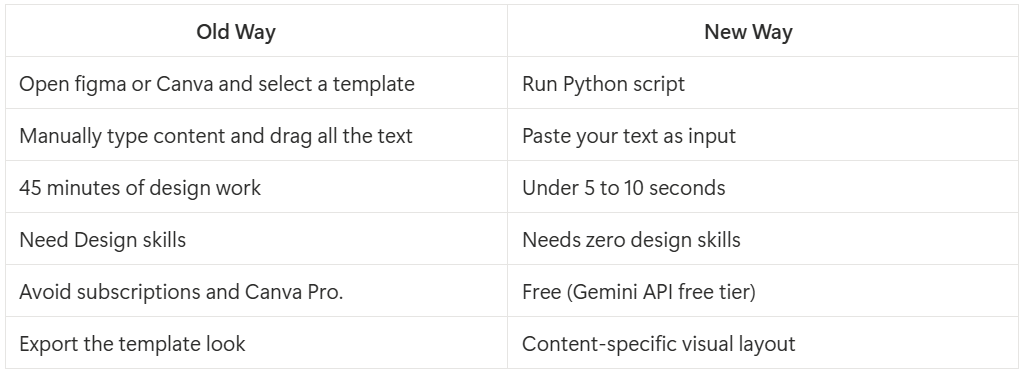
That’s exactly implemented here, and trust me, this workflow is perfectly executed. And the AI infographic image is easily understandable. This tool is especially useful for Students, Teachers, training centres, and business plan explanations.
How to convert the AI infographic generator from text to image before getting into the code?
Here’s the flow
First, you give a text as input; it could be like simple study notes, a theory explanation, a concept description, or anything.
The Python script sends a text to the Gemini API with a system prompt.
Then Gemini analyzes the text content and returns structured data like infographics and images.
The last step script converts that into a clean infographic image and saves it on your machine.
No paid tool. No daily fees. No monthly change, just using the Gemini API key (which is free) and Python code.
Step 1: The necessary packages you need to install.
Open your terminal screen and run this
pip install google-genai PillowThat’s it. Three packages are important for this step:
google-genai: Python software development kit for Gemini
Pillow: for imagery generation and rendering
Requests: You need to fetch anything online
Step 2: Get your Gemini API key for free
Go to the AI Studio AI Studio Google API key create a key, and keep it somewhere secure.
If you know the environment file, set it as a GEMINI_API_KEY environment parameter:
GEMINI_API_KEY="your-api-key-here"Step 3: Strong system prompt for AI infographic generator from text; this is a major element.
This is actually the most essential section. For Gemini, we will tell the system prompt completely how to process your input text content and return it in a format your script can turn into a visual image format. This script asks Gemini for structured JSON and draws the image itself with Pillow, so it uses the text model “gemini-2.5-flash”.
SYSTEM_PROMPT = """
You are an expert infographic content designer.
When given a block of text or theory, your job is to:
1. Extract the 4–6 most important key concepts or steps.
2. Write a short title for the infographic (max 8 words).
3. For each key concept, write a label (max 4 words) and a one-line explanation (max 15 words).
4. Return your response ONLY as a valid JSON object with this exact structure:
{
  "title": "...",
  "sections": [
    {"label": "...", "description": "..."},
    ...
  ]
}
Do not include any explanation, markdown, or extra text outside the JSON.
"""
Step 4: The full python script
import os
import json
from google import genai
from PIL import Image, ImageDraw, ImageFont

# --- Configure Gemini ---
client = genai.Client(api_key=os.environ["GEMINI_API_KEY"])
MODEL = "gemini-2.5-flash"

SYSTEM_PROMPT = """
You are an expert infographic content designer and visual information architect.

When given a block of text or theory, your job is to extract a structured visual layout for a
professional infographic.

Return ONLY a valid JSON object. No markdown. No explanation. No code fences. Just raw JSON.

The JSON must follow this exact structure:

{
  "title": "Short punchy infographic title (max 8 words)",
  "subtitle": "One-line description explaining the topic (max 12 words)",
  "sections": [
    {
      "number": "01",
      "label": "Section label (max 4 words)",
      "description": "Clear one-sentence explanation of this concept (max 18 words)",
      "icon_text": "SHORT 2-5 char abbreviation for this section e.g. SUN, ATP, DEF, LOOP"
    }
  ]
}

Rules you must follow:
1. Extract exactly 5 to 6 key concepts or steps from the input text.
2. Number them "01" through "05" or "06" as strings.
3. Each label must be 1-4 words, ALL CAPS in meaning (not formatting).
4. Each description must be a full sentence, clear and informative, max 18 words.
5. icon_text must be 2-5 characters, uppercase, a meaningful abbreviation — NOT a number.
6. subtitle must make the infographic self-explanatory at a glance.
7. Do NOT include any text outside the JSON object.
8. Do NOT wrap in markdown code blocks or backticks.
"""

# ─────────────────────────────────────────────────────────────
# USER PROMPT — Replace this text with anything you want
# ─────────────────────────────────────────────────────────────

USER_TEXT = """
Python is a beginner-friendly programming language known for its simple, readable syntax.
Core concepts include variables for storing data, control flow using if/else statements,
loops for repeating actions, and functions for reusable code blocks.
Data structures like lists and dictionaries are essential for managing collections of data.
Python's vast library ecosystem — including modules like os, math and requests —
lets you extend functionality without writing everything from scratch.
"""

# ─────────────────────────────────────────────────────────────
# GEMINI API CALL
# ─────────────────────────────────────────────────────────────

def generate_infographic_data(text):
    response = client.models.generate_content(
        model=MODEL,
        contents=SYSTEM_PROMPT + "\n\nHere is the input text to convert into an infographic:\n\n" + text,
    )
    raw = response.text.strip()

    # Safety strip — remove markdown fences if Gemini ignores instructions
    if raw.startswith("```"):
        raw = raw.split("```")[1]
        if raw.startswith("json"):
            raw = raw[4:]
    raw = raw.strip()

    return json.loads(raw)

# ─────────────────────────────────────────────────────────────
# INFOGRAPHIC RENDERER — Pillow
# ─────────────────────────────────────────────────────────────

FONT_BASE = "/usr/share/fonts/truetype/dejavu/"

def font(name, size):
    try:
        return ImageFont.truetype(FONT_BASE + name, size)
    except:
        return ImageFont.load_default()

def wrap_text(draw, text, fnt, max_width):
    words = text.split()
    lines, current = [], ""
    for word in words:
        test = (current + " " + word).strip()
        if draw.textlength(test, font=fnt) <= max_width:
            current = test
        else:
            if current:
                lines.append(current)
            current = word
    if current:
        lines.append(current)
    return lines

def rounded_rect(draw, xy, radius, fill):
    x1, y1, x2, y2 = xy
    r = radius
    draw.rectangle([x1+r, y1, x2-r, y2], fill=fill)
    draw.rectangle([x1, y1+r, x2, y2-r], fill=fill)
    draw.ellipse([x1,    y1,    x1+2*r, y1+2*r], fill=fill)
    draw.ellipse([x2-2*r,y1,    x2,     y1+2*r], fill=fill)
    draw.ellipse([x1,    y2-2*r,x1+2*r, y2    ], fill=fill)
    draw.ellipse([x2-2*r,y2-2*r,x2,     y2    ], fill=fill)

def create_infographic(data, output_path="infographic_output.png"):
    WIDTH      = 900
    HEADER_H   = 130
    SECTION_H  = 95
    FOOTER_H   = 55
    PADDING    = 32
    GAP        = 10
    n          = len(data["sections"])
    TOTAL_H    = HEADER_H + (n * (SECTION_H + GAP)) + FOOTER_H + PADDING

    img  = Image.new("RGB", (WIDTH, TOTAL_H), color="#F0F4F8")
    draw = ImageDraw.Draw(img)

    f_title    = font("DejaVuSans-Bold.ttf", 28)
    f_subtitle = font("DejaVuSans.ttf",      14)
    f_num      = font("DejaVuSans-Bold.ttf", 30)
    f_label    = font("DejaVuSans-Bold.ttf", 17)
    f_desc     = font("DejaVuSans.ttf",      13)
    f_footer   = font("DejaVuSans.ttf",      11)
    f_tag      = font("DejaVuSans-Bold.ttf", 11)

    HEADER_COLOR = "#1A237E"
    ACCENT_COLOR = "#42A5F5"
    WHITE        = "#FFFFFF"
    DARK         = "#1A1A2E"
    GRAY         = "#78909C"

    CARD_COLORS = [
        ("#1565C0","#E3F2FD"),
        ("#00695C","#E0F2F1"),
        ("#6A1B9A","#F3E5F5"),
        ("#E65100","#FFF3E0"),
        ("#1B5E20","#E8F5E9"),
        ("#B71C1C","#FFEBEE"),
    ]

    # ── Header ──
    draw.rectangle([(0,0),(WIDTH,HEADER_H)], fill=HEADER_COLOR)
    draw.rectangle([(0,HEADER_H-5),(WIDTH,HEADER_H)], fill=ACCENT_COLOR)
    draw.ellipse([(WIDTH-130,-60),(WIDTH+10,80)], fill="#283593")
    draw.ellipse([(WIDTH-90,-40),(WIDTH-10,40)],  fill="#3949AB")

    tag_w = draw.textlength("AI GENERATED", font=f_tag)
    rounded_rect(draw, (PADDING-6, 14, PADDING+tag_w+6, 36), 6, fill=ACCENT_COLOR)
    draw.text((PADDING, 18), "AI GENERATED", font=f_tag, fill=WHITE)

    draw.text((PADDING, 44), data["title"],    font=f_title,    fill=WHITE)
    draw.text((PADDING, 82), data["subtitle"], font=f_subtitle, fill="#90CAF9")

    badge = f"{n} Key Concepts"
    bw = draw.textlength(badge, font=f_tag)
    bx = WIDTH - bw - PADDING - 16
    rounded_rect(draw, (bx-8,46,bx+bw+8,64), 8, fill="#283593")
    draw.text((bx, 50), badge, font=f_tag, fill="#90CAF9")

    # ── Sections ──
    for i, section in enumerate(data["sections"]):
        accent_col, light_col = CARD_COLORS[i % len(CARD_COLORS)]
        y  = HEADER_H + PADDING//2 + i * (SECTION_H + GAP)
        x1, x2 = PADDING, WIDTH - PADDING

        # Shadow
        draw.rectangle([(x1+3,y+3),(x2+3,y+SECTION_H+3)], fill="#D0D8E0")
        # Card
        rounded_rect(draw, (x1,y,x2,y+SECTION_H), 10, fill=WHITE)
        # Left accent stripe
        rounded_rect(draw, (x1,y,x1+8,y+SECTION_H), 4, fill=accent_col)
        draw.rectangle([(x1+4,y),(x1+8,y+SECTION_H)], fill=accent_col)

        # Number badge circle
        num_size = 48
        nx = x1 + 20
        ny = y + (SECTION_H - num_size) // 2
        draw.ellipse([(nx,ny),(nx+num_size,ny+num_size)], fill=light_col)
        num_w = draw.textlength(section["number"], font=f_num)
        draw.text((nx+(num_size-num_w)//2, ny+8), section["number"], font=f_num,
        fill=accent_col)

        # Label + underline
        label_x = nx + num_size + 18
        label_y = y + 16
        draw.text((label_x, label_y), section["label"].upper(), font=f_label, fill=DARK)
        lw = draw.textlength(section["label"].upper(), font=f_label)
        draw.rectangle([(label_x, label_y+22),(label_x+lw*0.4, label_y+24)], fill=accent_col)

        # Description
        lines = wrap_text(draw, section["description"], f_desc, x2-label_x-70)
        for j, line in enumerate(lines[:2]):
            draw.text((label_x, label_y+32+j*18), line, font=f_desc, fill=GRAY)

        # Icon badge (right side)
        icon_x = x2 - 55
        icon_y = y + (SECTION_H - 36) // 2
        draw.ellipse([(icon_x,icon_y),(icon_x+40,icon_y+40)], fill=light_col)
        iw = draw.textlength(section["icon_text"], font=f_tag)
        draw.text((icon_x+(40-iw)//2, icon_y+13), section["icon_text"], font=f_tag,
        fill=accent_col)

    # ── Footer ──
    fy = TOTAL_H - FOOTER_H
    draw.rectangle([(0,fy),(WIDTH,TOTAL_H)], fill=HEADER_COLOR)
    draw.rectangle([(0,fy),(WIDTH,fy+3)],    fill=ACCENT_COLOR)
    draw.text((PADDING, fy+18),
              "powered by Gemini API + Python",
              font=f_footer, fill="#90CAF9")
    rw = draw.textlength("agentzee.ai", font=f_tag)
    draw.text((WIDTH-PADDING-rw, fy+18), "agentzee.ai", font=f_tag, fill=ACCENT_COLOR)

    img.save(output_path, "PNG", quality=95)
    print(f"Infographic saved: {output_path}")

# ─────────────────────────────────────────────────────────────
# RUN
# ─────────────────────────────────────────────────────────────

if __name__ == "__main__":
    print("Sending text to Gemini...")
    data = generate_infographic_data(USER_TEXT)
    print("Structured data received:")
    print(json.dumps(data, indent=2))
    create_infographic(data, "infographic_output.png")
Step 5: Sample input text block
For example, photosynthesis is the sample block text. This topic is one that every biology learner has read 15 times and still can’t convey properly at 11 pm before an exam.
Photosynthesis is the process by which green plants convert sunlight into food.
Using chlorophyll in their leaves, plants absorb sunlight and use it alongside
carbon dioxide from the air and water from the soil to produce glucose and oxygen.
This process occurs in two stages: the light-dependent reactions in the thylakoid
membranes, and the Calvin cycle in the stroma of the chloroplast.
Photosynthesis is the foundation of most food chains on Earth.
Step 6: Running the Python script
Whatever the use, give the file name; by using that, you run the script, e.g., infographic_generator.py
python3 infographic_generator.pyExpected output:
Sending text to Gemini...
Structured data received:
{
  "title": "How Photosynthesis Works",
  "sections": [...]
}
Infographic saved: infographic_output.png
Sample Response
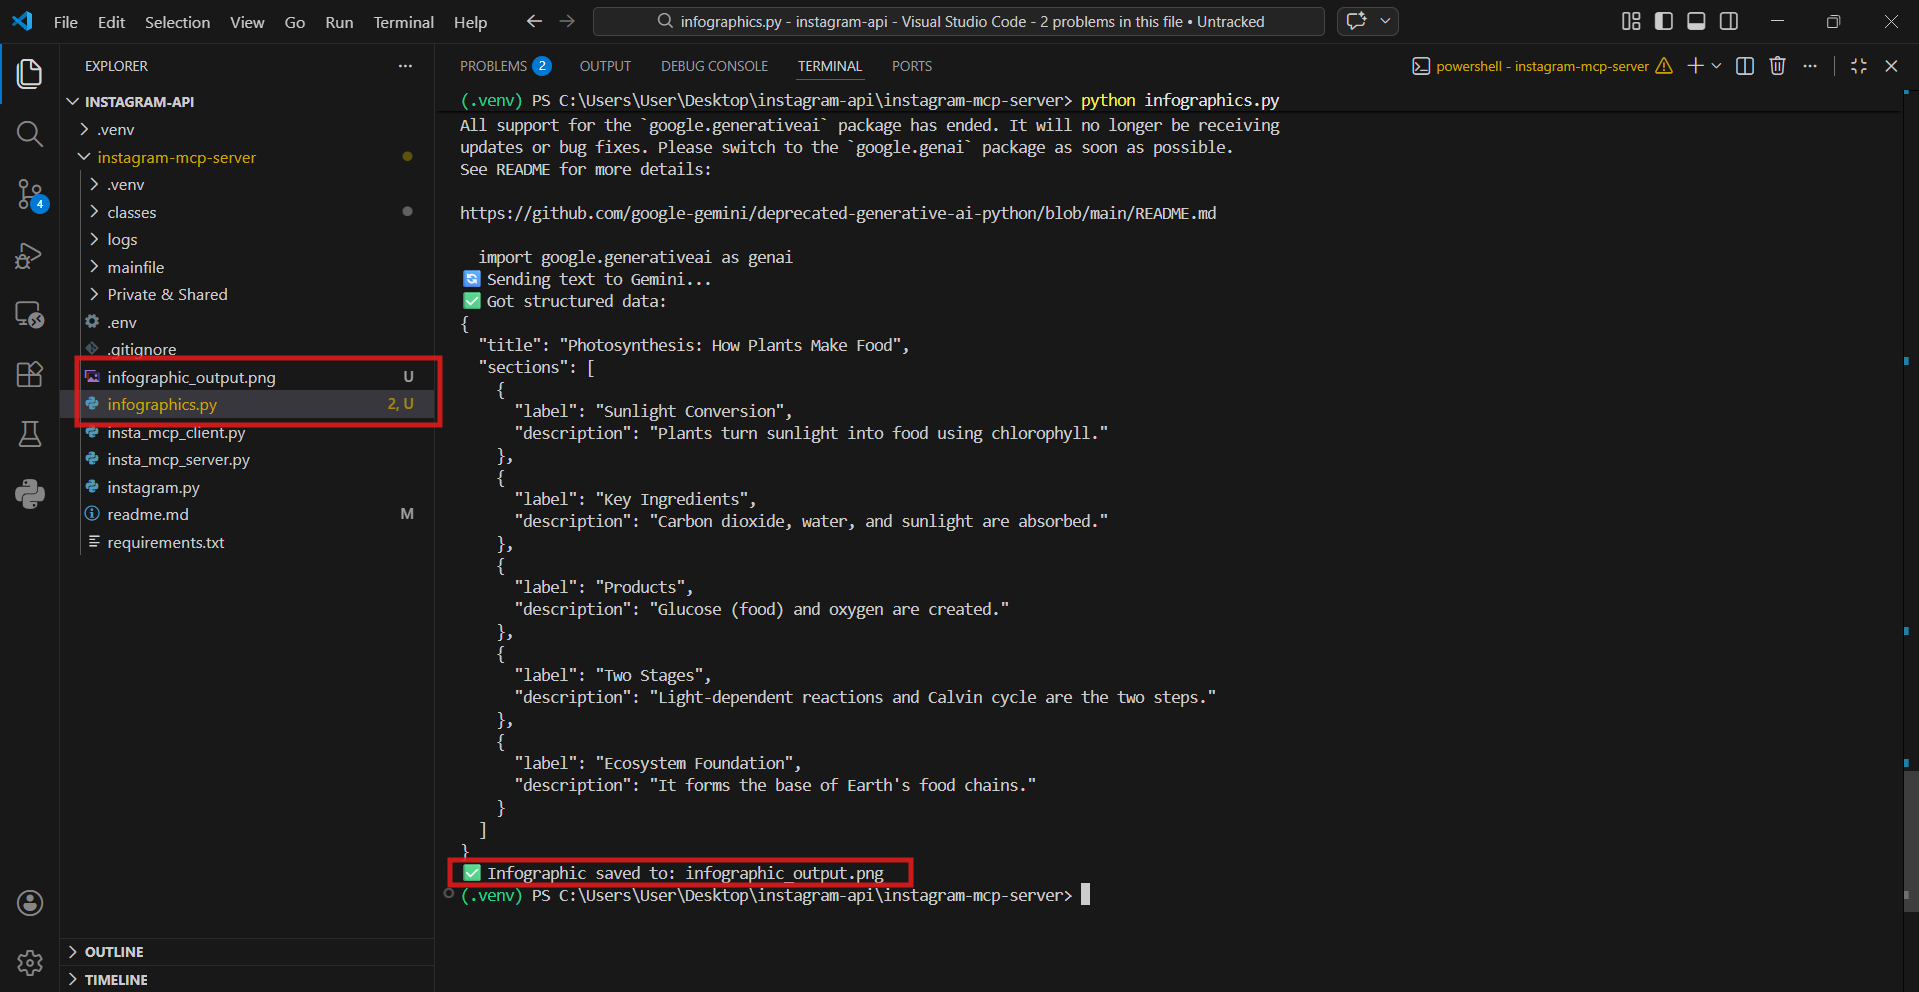
Here’s the actual image generated by the script from the Photosynthesis input text above: After running the Python script file in my local directory, save the AI infographic generator image.
That’s all. Six lengthy paragraphs of biology concepts, converted into a clean, colour-coded, numbered visual, are saved as a PNG in your working directory. In under 5 seconds.
No Canva. No designer. No manual layout.
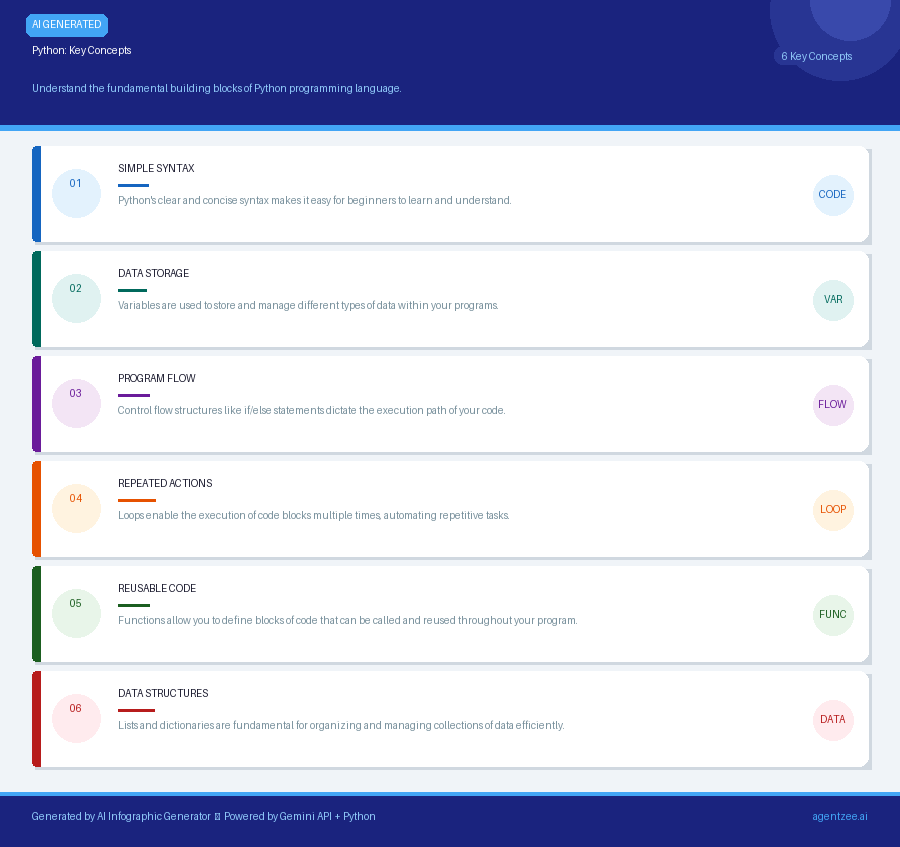
An advanced AI infographic generator from text with a public infographic image (reference image).
Why the Reference Image Is the Most Important Input
When you ask AI using input as text content to “make infographics” like this, you will get the same layout with a generic design every time. Because the AI does not think that infographics should look like this.
But the advanced infographic generator from the reference image, plus the user prompt, equals the final infographic image when you execute it on an existing or public infographic image. The font style, grid layout, icon weight, and colour palette now have a template to work from. Not copying the content. replicate the style and design.
Already, I have explained the system setup, Step 1 & Step 2 in the previous infographic generator from text concepts, which I followed for this. Only changes in the Python script and the input elements.
Same system setup for the infographic generator from the reference image.
Only change the Python code.
No changes in the Gemini API generator.
Generator with reference image.
Inputs:
reference_image.png: Which infographic image do you want to clone?
user_prompt: Raw text you want to turn into your infographic
Output:
generated_infographic.png: This generated an infographic image.
You’re thinking, where are steps 1 and 2 correct? That’s already decided. The previous use case I explained first had been set up after continuing this part:
Step 3: Strong system prompt for an AI infographic generator from text with a reference image.
This is actually the most essential section. For Gemini, we will tell the system prompt completely how to process your input reference image with text content and return it in a format your script can turn into a visual image format. For the image generator, we can define the Gemini model as “gemini-2.5-flash-image”; we are using this model.
SYSTEM_PROMPT = """
You are a professional infographic designer AI.

Use the reference image only for layout style.
Do not copy its text.

Generate a new infographic using the user content.
Match the layout, colors, spacing, and icon style.

Output a high-resolution infographic image.
"""
Step 4: Python script for reference image with text input.
import os
from google import genai
from PIL import Image
from pathlib import Path

# ─── CONFIG ───────────────────────────────────────────
GEMINI_API_KEY = os.environ["GEMINI_API_KEY"]
REFERENCE_IMAGE_PATH = "your_local_image_path_here"
OUTPUT_PATH = "output/generated_infographic.png"

# ─── SYSTEM PROMPT ────────────────────────────────────
SYSTEM_PROMPT = """
You are a professional infographic designer AI.

Use the reference image only for layout style.
Do not copy its text.

Generate a new infographic using the user content.
Match the layout, colors, spacing, and icon style.

Output a high-resolution infographic image.
"""

# ─── MAIN FUNCTION ────────────────────────────────────
def generate_infographic(user_prompt: str, reference_image_path: str, output_path: str):

    client = genai.Client(api_key=GEMINI_API_KEY)

    reference_image = Image.open(reference_image_path)

    full_prompt = f"""
Analyze the reference infographic style.

Now generate a NEW infographic using this content:

{user_prompt}

Match layout and visual style.
"""

    response = client.models.generate_content(
        model="gemini-2.5-flash-image",
        contents=[SYSTEM_PROMPT, full_prompt, reference_image]
    )

    Path("output").mkdir(exist_ok=True)

    for part in response.candidates[0].content.parts:
        if hasattr(part, "inline_data") and part.inline_data:
            with open(output_path, "wb") as f:
                f.write(part.inline_data.data)

            print(f"Infographic saved to: {output_path}")
            return output_path

    print("No image generated.")
    return None


# ─── RUN ──────────────────────────────────────────────
if __name__ == "__main__":

    USER_PROMPT = """
Topic: Photosynthesis

Key Points:
- Sunlight: Plants capture energy from the sun
- Chlorophyll: Pigment that absorbs light
- Carbon Dioxide: Taken from the air
- Water: Absorbed by roots
- Glucose Production: Plants create food for growth

Fun Fact:
Photosynthesis produces most of the oxygen we breathe.
"""

    generate_infographic(
        user_prompt=USER_PROMPT,
        reference_image_path=REFERENCE_IMAGE_PATH,
        output_path=OUTPUT_PATH
    )
Step 5: Sample Input with reference image and text block
For example, Photosynthesis is the sample block text. This topic is one that every biology learner has read 10 times and still can’t explain properly at 11 pm before an exam.
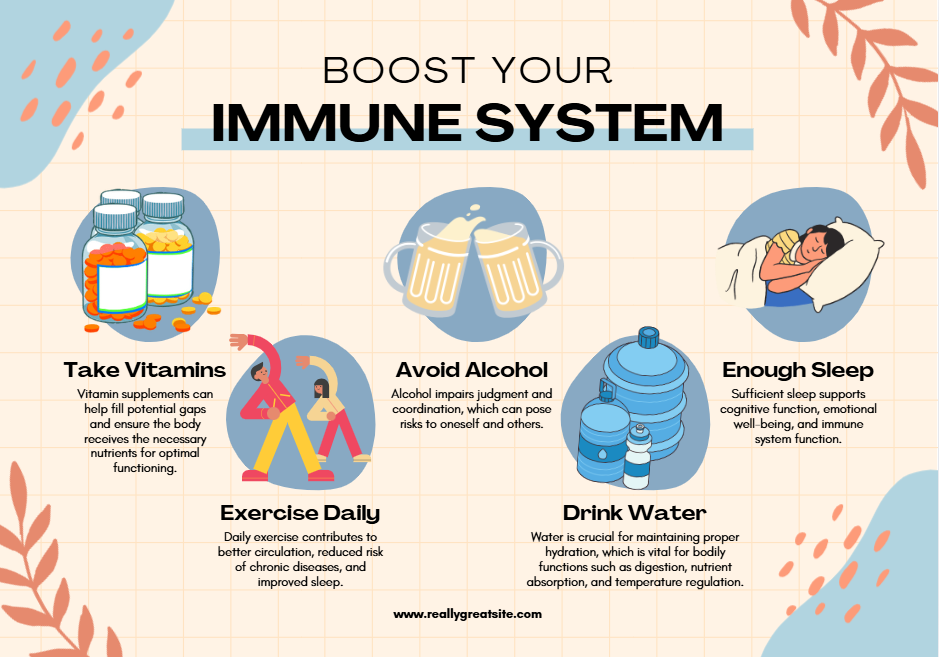
REFERENCE_IMAGE_PATH = “infographics reference image.png”
REFERENCE_IMAGE_PATH = "infographics reference image.png"  # or the path to your own image


USER_PROMPT = """
Topic: Photosynthesis

Key Points:
- Sunlight: Plants capture energy from the sun
- Chlorophyll: Pigment that absorbs light
- Carbon Dioxide: Taken from the air
- Water: Absorbed by roots
- Glucose Production: Plants create food for growth

Fun Fact:
Photosynthesis produces most of the oxygen we breathe.
"""
Step 6: Running the Python script with a reference image
Whatever the use, give the file name; by using that, you run the script, e.g., infographic_generator.py
python3 reference_infographic.py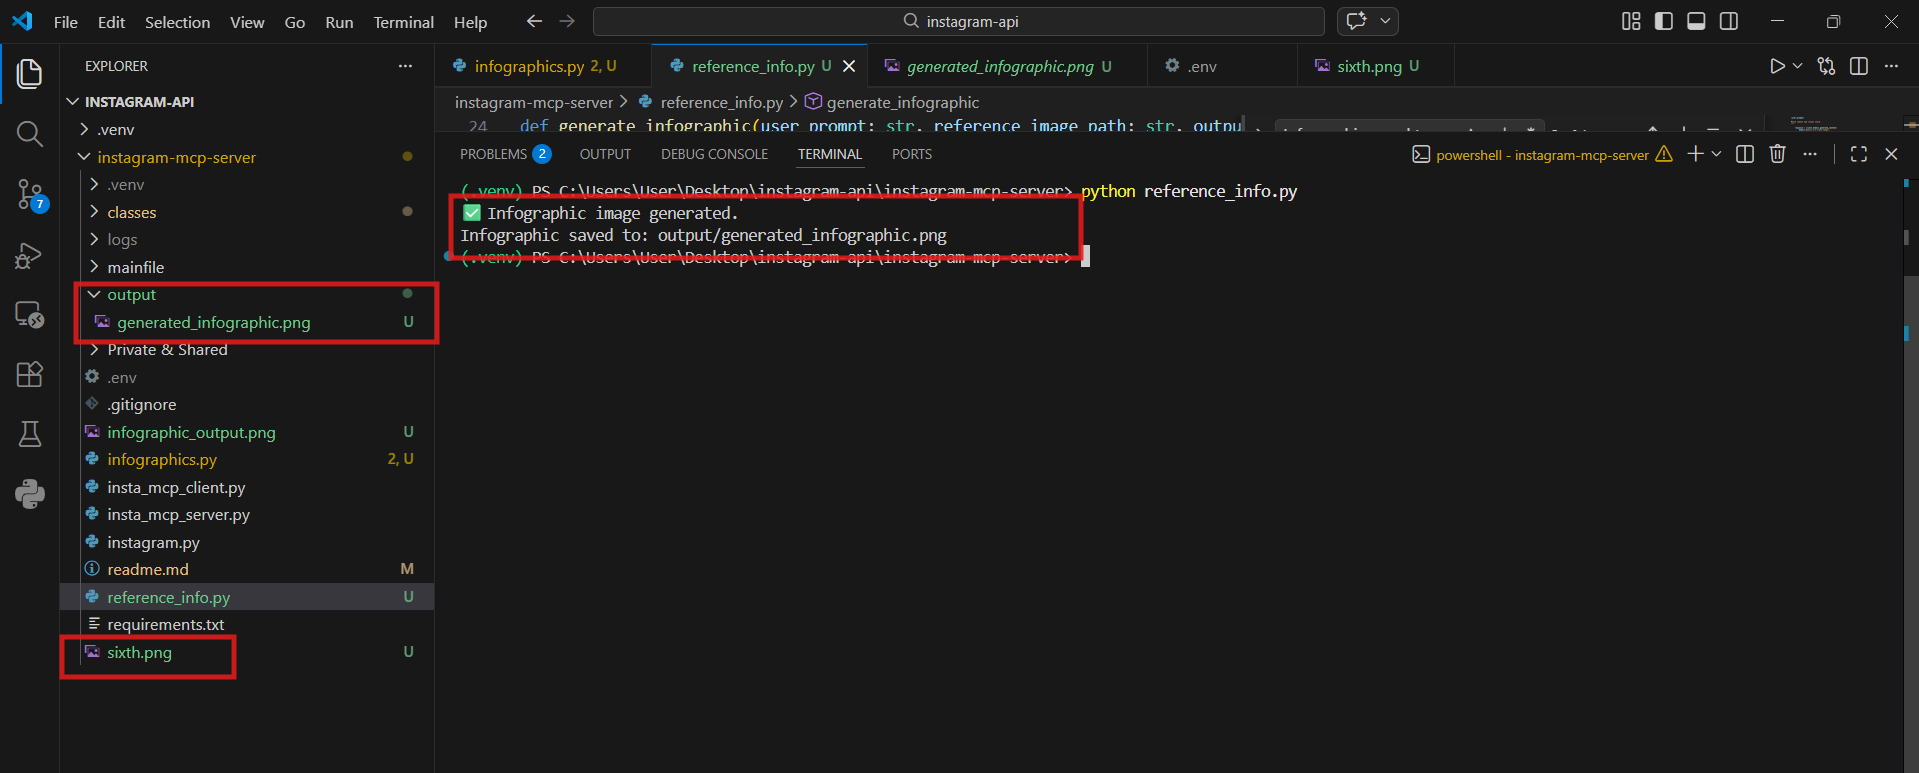
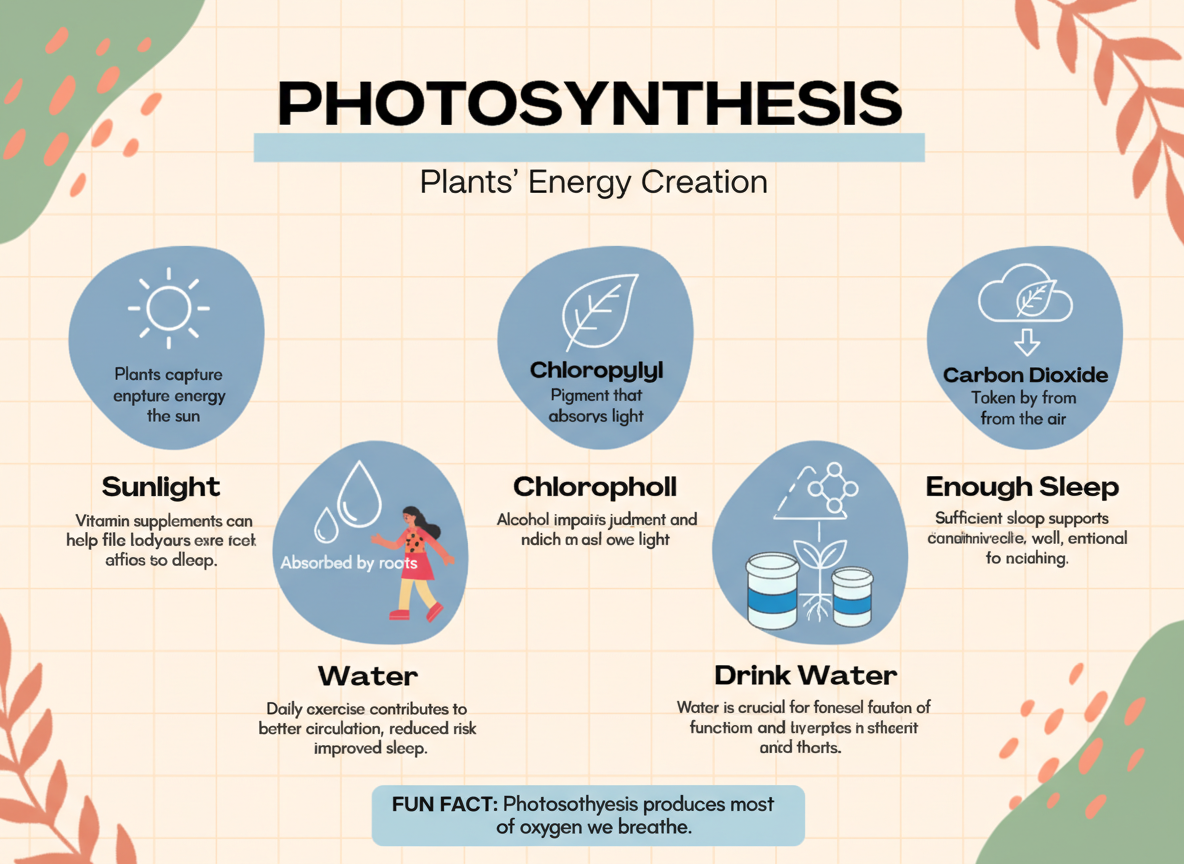
Here’s the actual image generated by the script from the photosynthesis, using the reference image with the text block. After running the Python script file in my local directory, save the AI infographic generator image.
Generator Infographic from text to final Image (Using Python script)
Real-world use cases
You can use this AI infographic generator system for:
Blog content visuals and convert the blog post to an infographic.
Online course materials
Instagram learning posts
Lead magnets
Classroom teaching aids.
Turn lecture notes into visuals
Create Pinterest content
Generate social media educational posts
An infographic generator with a reference image, whether for learning or students, makes the process simple. It’s just a few easy steps; I explained in the previous section how you can set up the machine and type your text content or attach the reference image without wasting time. There are no complicated system setups, just fast implementation and a smooth, hassle-free AI infographic generator from text or a reference image.
This generator does not rely on one individual’s effort; it requires strong team collaboration. Every member contributes their ideas and dedication. We have successfully implemented this workflow in our product. Want to make an AI infographic generator easier? We have already streamlined this whole working process on our website Agentzee Workflow. Feel free to give it a try.
Conclusion
Your brain wants visuals. It has always wanted a visual AI infographic generator from text to image conversion. And now, with about 150 lines of Python script and a free Gemini API key, students, content creators, teachers, or social media posters can easily grasp complex concepts, and it takes only a few minutes to understand them.
For this, we do not need designing skills; there are just a few easy methods. Paste text or attach a reference image. Get a final infographic image. Read faster. Study smarter. That’s it. Now stop reading this and go run the script.
If you need to generate an Infographics image through the Agentzee platform, we have already implemented this workflow. To generate an Infographics image agent for your existing business and improve efficiency and productivity.
Check out our product