
It was an evening 🌃 on a fine day. You’ve been glued to client calls since breakfast. Your Slack is exploding with unread messages. And bam 💣, three emails hit your inbox in six minutes.
“Send me today’s Facebook analytics for ads that started last week.”
“What caused conversions to dip yesterday?”
“Which creative is winning this week?”
You glance at your to-do list. You have two campaign optimizations left to complete, a creative review at 5, and your lunch has been sitting abandoned on your desk for two hours.
But alright, fine, jump back into Facebook Ads Manager again for the seventh time today. All manually.
Sound exhausting😮💨? Yeah. Welcome to the unknown side of running a growing digital marketing agency.
The silent crisis in reporting
This is what you need to know about growing a digital marketing agency. The goal 🎯 is to get more clients.
Reporting for all of them? That’s the bad dream.
You run an agency that is growing in a city where there is a lot of competition. A small but focused team of a few people. Things are going well for business. People are sending in referrals. Every week, new campaigns start. Every day, new ads go live.
Clients are all chasing the same thing: their Facebook ad performance from yesterday. They’re looking for which creative actually pulled the most clicks and how the CPC and CPM trends are shifting. It isn’t just about whether the ROAS improved; they want to see the exact moment a prospect dropped off and understand where every single dollar is being spent. Most importantly, they aren’t willing to wait until tomorrow for those answers.
You can’t log into Facebook Ads Manager by hand for each client more than once a day. You can’t write long summaries, build charts📊 , compare different ads, and download spreadsheets 𝄜 for 15 or 20 clients every day. You are one person. Or even three. But not twenty for sure.
In a market with a lot of other agencies, slow 🐌 reporting makes you look bad; even clients lose faith when they constantly nudge you to share the Facebook analytics for ads. This is because their decision is based on the analytics data. If you can’t share it at the right time, then no one is going to defend your reputation.
Why traditional Facebook analytics for ads falls short
The truth is that Facebook Ads Manager is a very useful ⚡ tool. It was made to make and run campaigns, ad sets, and ads, not to make reports that clients can easily understand.
When you try to get Facebook analytics for ads by hand, this is what usually happens:
You log into Business Manager. 🔄Switch to the right ad account. Set the date range 📅. Filter by campaign. Then by ad set. Then by individual ad. Export to CSV. Open it in Google Sheets or Excel. Build a pivot table. Add some charts. Write a summary. Format it so it doesn’t look like a tax document. Email ✉️ it to the client.
That’s one client. One report, roughly 25 to 40 minutes if you’re fast.
Now, do that 15 times for each client. It roughly takes 6 to 10 hours ⏳ daily, and that’s before someone else’s follow-up question: “How did last week’s video ad perform compared to this week’s Carousel?” which dumps you back into the Ads Manager rabbit hole 🕳️.
Taking the manual route doesn’t just devour your time. It devours your capacity to do the actual work that helps those campaigns grow.
What a proper Facebook ad performance report actually needs
First, let’s clarify what we mean when clients ask, “Send me the analytics,” because it isn’t just a screenshot of Ads Manager; that would be too easy.
📊 The Facebook analytics for ads report should have the following details:
Ad-level details:
Name of the ad
Name of the ad set
Name of the campaign
Key details:
Impressions (number of times ad got displayed)
Reach (no. of unique users who viewed your ad)
Clicks (number of times your ad got clicked)
Spend (total amount spent on ad)
CPC (Cost Per Click is the amount paid per click)
ROAS (Return on Ad Spend is revenue generated for every amount spend)
CPM (Cost Per Mille is Cost per 1,000 impressions),
Budget Details :
Total budget allotted for each campaign
The above Facebook analytics for ads report provides valuable information to make the client’s Facebook ad campaigns work better.
Presenting an analytical AI agent that works without rest
Here’s where it’s getting interesting 💡.
Implement an automated reporting pipeline that leverages the Facebook Graph API to aggregate multi-account ad analytics. The system will perform cross-campaign performance benchmarking and generate daily, insight-driven reports for automated client delivery.
It places the Facebook ads analytics report in the client’s inbox 📬, before the client thinks of asking for it.
This isn’t just a concept; it is a practical application driven by the capabilities of AI and the Facebook marketing API.
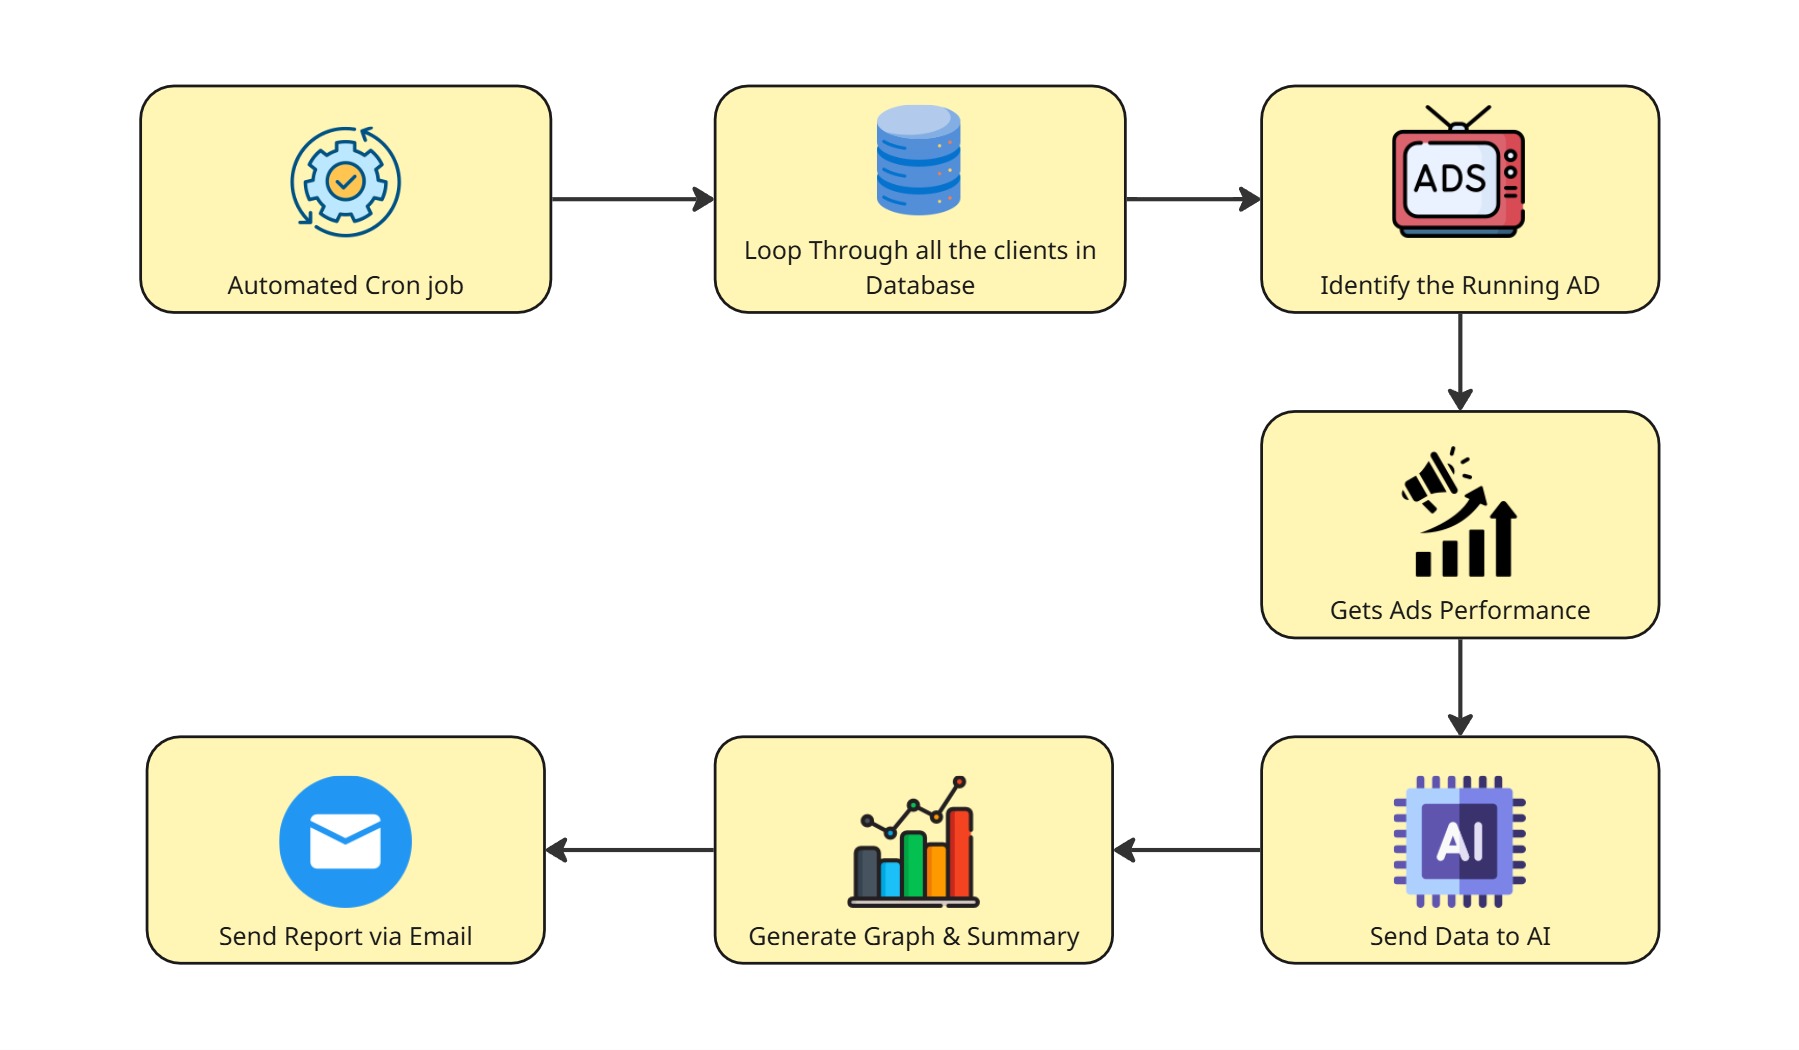
The workflow: how it actually works
I’ll divide this down into steps. Since “AI does it for you” sounds fantastic in theory, you definitely want to understand how it works.
Step 1: Automated cron job
The entire pipeline is started implicitly every morning at 6 AM by a scheduled task (built with Celery, a Python task queue). Not a single alarm⏳. Not using any manual triggers. After waking up, the scheduler determines which clients are configured and initiates the reporting process for each one at once.
This represents the system’s heartbeat. This one silent trigger must operate each day consistently for everything downstream to function.
Step 2: Loop through every client account
The Python code iterates through your client list, which is present in the database, pulling each one’s connected Facebook Ad Account ID and the access token. It will loop every client, even 50 or even 100 clients in a single run. One scheduler. All accounts. No manual switching.
Step 3: Identify the running ads
For every client, there is no point in pulling the paused or completed ads for daily reports; for that, a Python code will identify the running ads using the Facebook Marketing API.
GET https://graph.facebook.com/v24.0/act_AD_ACCOUNT_ID/ads?fields=name,status,effective_statusoutput:
{
  "data": [
    {
      "name": "Summer_Sale_Video_Ad",
      "status": "ACTIVE",
      "effective_status": "ACTIVE",
      "id": "238500111222333"
    },
    {
      "name": "Retargeting_Static_Image",
      "status": "ACTIVE",
      "effective_status": "CAMPAIGN_PAUSED",
      "id": "238500444555666"
    },
    {
      "name": "Holiday_Special_Draft",
      "status": "PAUSED",
      "effective_status": "PAUSED",
      "id": "238500777888999"
    },
    {
      "name": "New_Product_Launch",
      "status": "ACTIVE",
      "effective_status": "PENDING_REVIEW",
      "id": "238500999000111"
    }
  ],
  "paging": {
    "cursors": {
      "before": "MAZDZD",
      "after": "MQZDZD"
    }
  }
}
The system will then read the output and determine the ads currently running by using the “status” and “effective_status” fields as references.
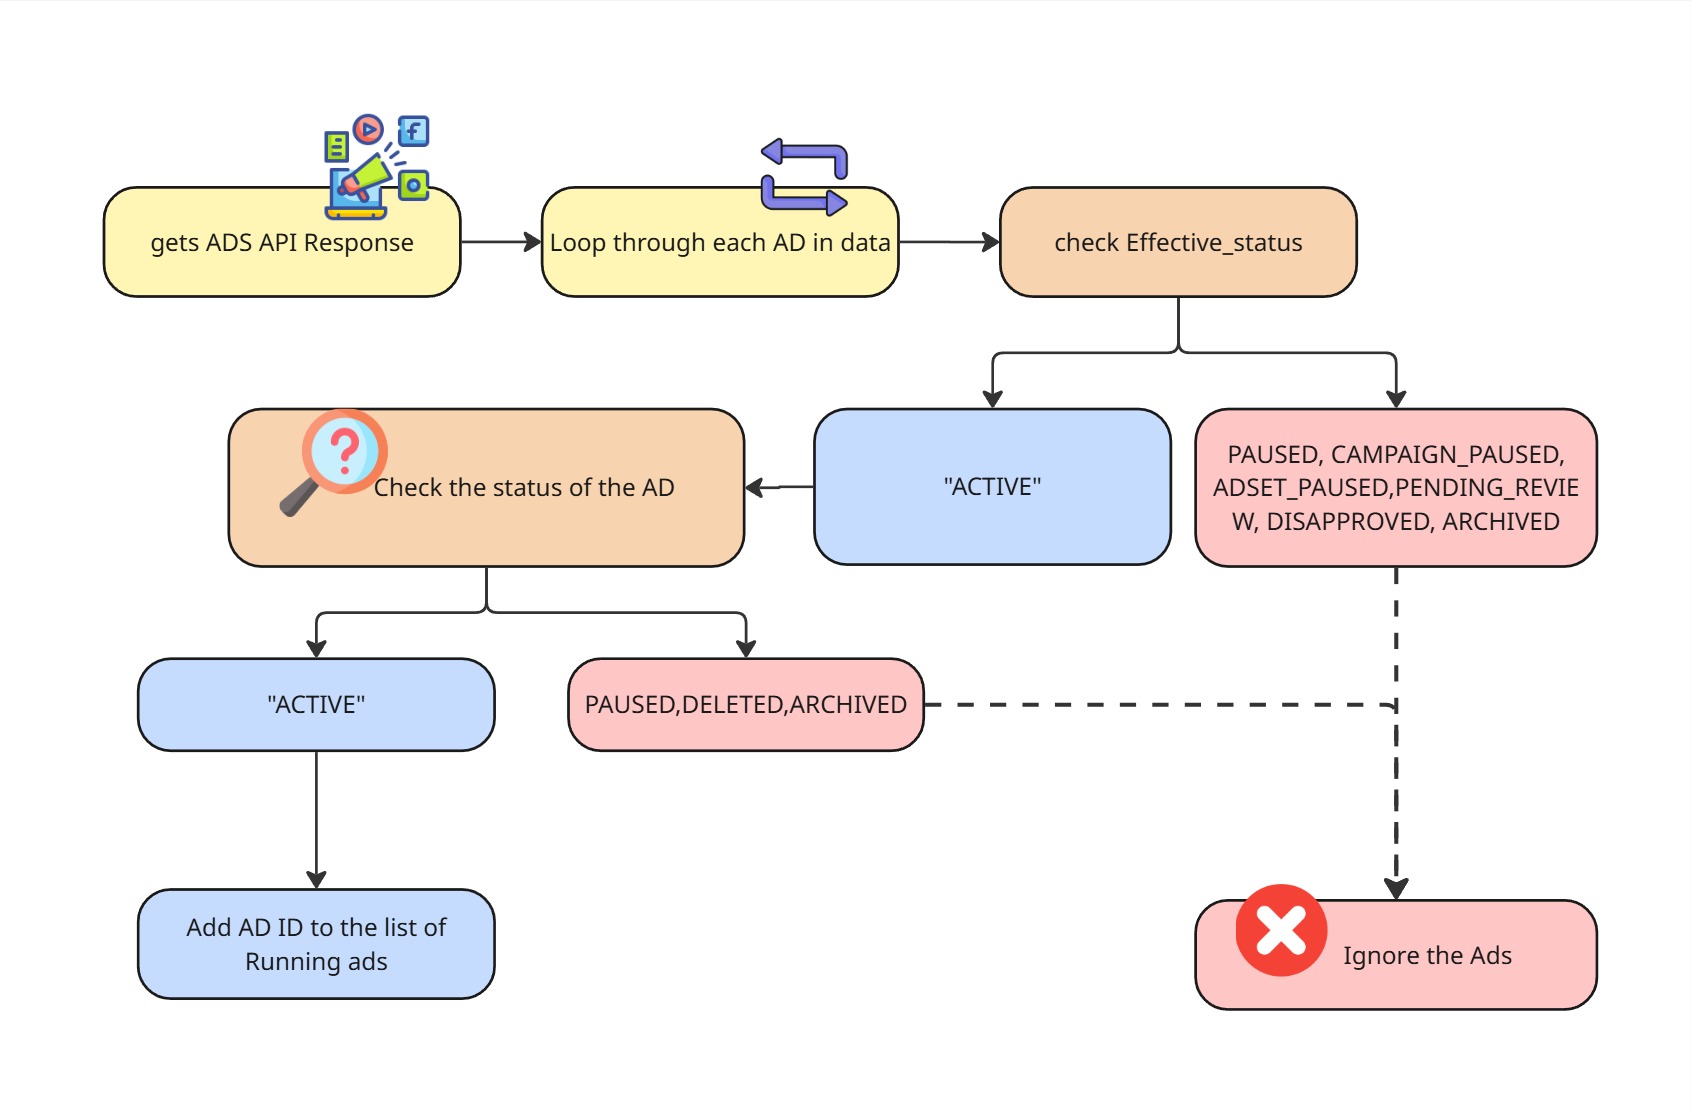
if effective_status == "ACTIVE" and status == "ACTIVE":
    running_ads.append(ad_id)
This way, your Facebook ads analytics report for ads will only show active ads.
Step 4: Pull performance data for each ad
We can use the Facebook API to obtain the ID of the running advertisement from the aforementioned API. We can obtain the ad’s performance by using the ID.
The system makes another API call for each running ad in order to retrieve yesterday’s performance metrics. This is returned by the Facebook API as structured JSON, which the system saves and transmits.
This structured JSON becomes the raw Facebook analytics for ads dataset used for reporting.
GET https://graph.facebook.com/v24.0/AD_ID/insights?fields=ad_name,campaign_name,adset_name,
impressions,reach,clicks,spend,cpc,purchase_roas,cpm&time_range={'since':'2026-02-26',
'until':'2026-02-26'}
Here is the sample output from the API
{
  "data": [
    {
      "ad_name": "Summer_Sale_Video_Ad",
      "campaign_name": "Summer_Brand_Awareness_2026",
      "adset_name": "US_Targeting_Video_Views",
      "impressions": "12500",
      "reach": "10200",
      "clicks": "450",
      "spend": "150.75",
      "cpc": "0.335",
      "cpm": "12.06",
      "purchase_roas": [
        {
          "action_type": "purchase",
          "value": "4.25"
        },
        {
          "action_type": "website_purchase",
          "value": "3.80"
        }
      ],
      "date_start": "2026-02-26",
      "date_stop": "2026-02-26"
    }
  ],
  "paging": {
    "cursors": {
      "before": "MAZDZD",
      "after": "MAZDZD"
    }
  }
}
Step 5: AI reads the JSON and generates insights + graphs
The raw JSON goes straight into the AI agent. It doesn’t just reformat numbers — it reads performance trends, spots anomalies, compares creatives, and writes a plain-English summary a client can actually understand.
It also generates visual graphs so the data tells a story at a glance. No pivot tables. No manual chart-building. The AI handles it.
Step 6: Deliver before they ask
The system sends reports on time. Done every day at 9 AM. Two times a week? Of course. Alerts in real time when something goes wrong? Of course.
Your client opens their email and sees a clean report with useful information. They think, “Wow, this agency is on top of things.” You haven’t opened Ads Manager yet, though.
Your Facebook analytics for ads report arrives before they even ask for it.
That’s not being lazy. That’s leverage.
The numbers that make this a no brainer
Let’s do some quick math. I know you’re the kind of person who needs to see the return on investment (ROI) before making a decision. Same here.
If you have 15 clients and spend 30 minutes generating a Facebook analytics for ads report for each, you earn up to $11,250 for the month, working 20 days with a working rate of $75 per hour.
Now imagine generating that same revenue without spending the whole day pulling Facebook analytics for ads manually. By automating Facebook analytics for ads, you can free up to 7 hours daily and use them for improving the business, which improves the revenue, not the working hours.
That same task is completed in minutes by an AI-powered automated Facebook analytics for ads reporting tool. for a small portion of the price. Additionally, it doesn’t send Client A’s numbers to Client B by mistake, call in sick, or forget a client. Everybody has been there. Let’s avoid discussing it.
You could recover more than 1,800 hours over the course of a year. You could use that time for strategy, client acquisition, creative testing, or, to be honest, just having a regular lunch.
Where Agentzee fits into this
If you are reading this and thinking about “who actually built a system for Facebook analytics for ads?”
Agentzee build specifically an agent for workflows like Facebook analytics for ads. Without requiring you to oversee the process, this AI agent connects to your marketing platforms, gathers the analytics, creates the insights, and sends them to your clients.
Whether it’s Facebook analytics for ads, Instagram campaign performance, or cross-platform reporting, Agentzee handles the heavy lifting so you can focus on the work that actually requires a human brain.
If you’re the founder of a marketing agency who is tired of spending more time pulling the data from Facebook rather than making strategic decisions to improve the number of clients, it might be worth a look.
Conclusion
The unpleasant reality that most agency owners would prefer not to hear is that you are the bottleneck if you are the one who creates reports by hand each day. Not your customers. Not Facebook’s awkward user interface. You.
And that’s not a knock, but a trend that every expanding organisation must deal with. The same work that brought you here will not bring you to the next level. To speak to the $300/hour work, you must eventually stop doing the $75/hour work.
Removing yourself from the process is not the goal of automating your Facebook analytics for ads. The goal is to eliminate the steps in the process that don’t require your involvement. Data extraction, chart creation, and CSV manipulation
To integrate our analytics agent into your existing business and improve efficiency and productivity, please check out our product.